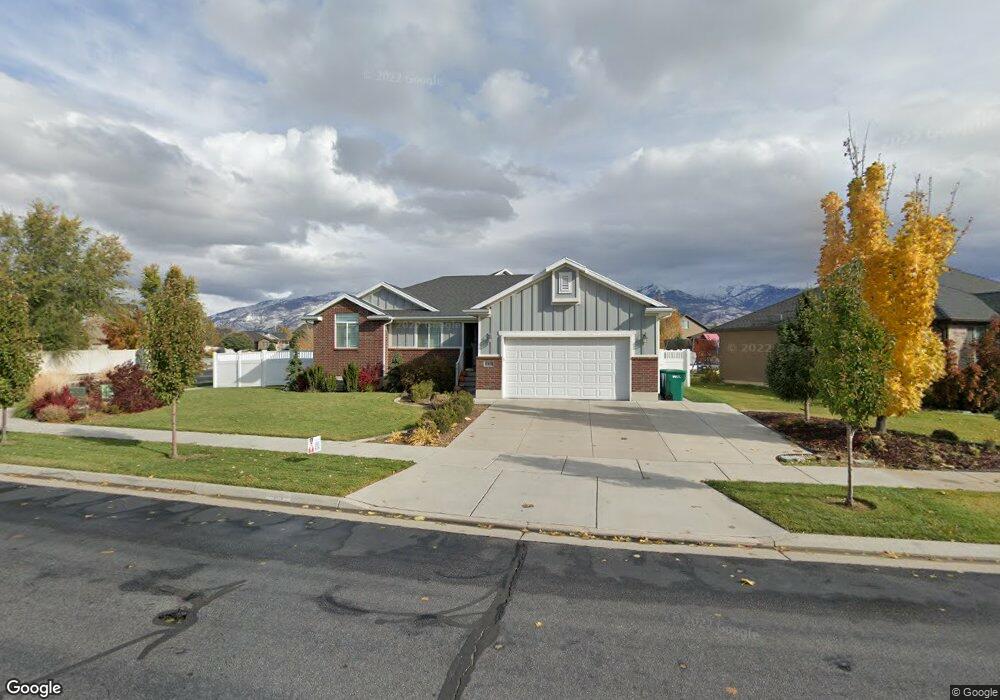
569 S 850 W Layton, UT 84041
Estimated Value: $638,000 - $718,000
5
Beds
4
Baths
1,582
Sq Ft
$426/Sq Ft
Est. Value
About This Home
This home is located at 569 S 850 W, Layton, UT 84041 and is currently estimated at $674,088, approximately $426 per square foot. 569 S 850 W is a home with nearby schools including Heritage Elementary School, Shoreline Junior High School, and Layton High School.
Ownership History
Date
Name
Owned For
Owner Type
Purchase Details
Closed on
Mar 24, 2021
Sold by
Oberg Christopher and Oberg Brandi
Bought by
Oberg C Lane C and Oberg Brandi
Current Estimated Value
Home Financials for this Owner
Home Financials are based on the most recent Mortgage that was taken out on this home.
Original Mortgage
$270,000
Outstanding Balance
$242,159
Interest Rate
2.73%
Mortgage Type
VA
Estimated Equity
$431,929
Purchase Details
Closed on
Apr 4, 2014
Sold by
Oberg Christopher L and Oberg Brandi L
Bought by
The Christopher And Brandi Oberg Family and Oberg Brandi
Home Financials for this Owner
Home Financials are based on the most recent Mortgage that was taken out on this home.
Original Mortgage
$312,635
Interest Rate
4.25%
Mortgage Type
VA
Purchase Details
Closed on
Mar 28, 2014
Sold by
Ed Green Construction Inc
Bought by
Oberg Christopher L and Oberg Brandi L
Home Financials for this Owner
Home Financials are based on the most recent Mortgage that was taken out on this home.
Original Mortgage
$312,635
Interest Rate
4.25%
Mortgage Type
VA
Create a Home Valuation Report for This Property
The Home Valuation Report is an in-depth analysis detailing your home's value as well as a comparison with similar homes in the area
Home Values in the Area
Average Home Value in this Area
Purchase History
| Date | Buyer | Sale Price | Title Company |
|---|---|---|---|
| Oberg C Lane C | -- | Real Advantage Title Ins | |
| Oberg Christopher | -- | Real Advantage Title Ins | |
| The Christopher And Brandi Oberg Family | -- | Security Title Of Davis Cnty | |
| Oberg Christopher L | -- | Security Title Of Dav |
Source: Public Records
Mortgage History
| Date | Status | Borrower | Loan Amount |
|---|---|---|---|
| Open | Oberg Christopher | $270,000 | |
| Closed | Oberg Christopher L | $312,635 |
Source: Public Records
Tax History Compared to Growth
Tax History
| Year | Tax Paid | Tax Assessment Tax Assessment Total Assessment is a certain percentage of the fair market value that is determined by local assessors to be the total taxable value of land and additions on the property. | Land | Improvement |
|---|---|---|---|---|
| 2025 | $3,181 | $333,850 | $110,802 | $223,048 |
| 2024 | $3,064 | $323,950 | $122,590 | $201,360 |
| 2023 | $3,064 | $571,000 | $121,259 | $449,741 |
| 2022 | $3,358 | $339,900 | $75,863 | $264,037 |
| 2021 | $3,193 | $482,000 | $113,820 | $368,180 |
| 2020 | $2,886 | $418,000 | $95,725 | $322,275 |
| 2019 | $2,827 | $401,000 | $98,440 | $302,560 |
| 2018 | $2,732 | $389,000 | $86,314 | $302,686 |
| 2016 | $2,408 | $176,880 | $33,796 | $143,084 |
| 2015 | $2,266 | $158,015 | $33,796 | $124,219 |
| 2014 | $1,088 | $77,604 | $33,796 | $43,808 |
Source: Public Records
Map
Nearby Homes
- 562 S 850 W
- 362 S 950 W
- 296 S 950 W
- 774 W Farming Way
- 557 S Angel St
- 1038 S Old Towne Rd
- 1042 W Shoreline Dr
- 267 S Melody St
- 933 W Gentile St
- 750 W Gentile St
- Creighton Farmhouse Plan at Angel Hill
- 485 W 100 N
- 174 W Dawson St
- 355 W Gentile St
- 356 W 25 N
- 796 S Rock Creek Corner
- 268 E 900 S
- 6 Grover St
- 282 E 925 S
- 256 Seemore Dr