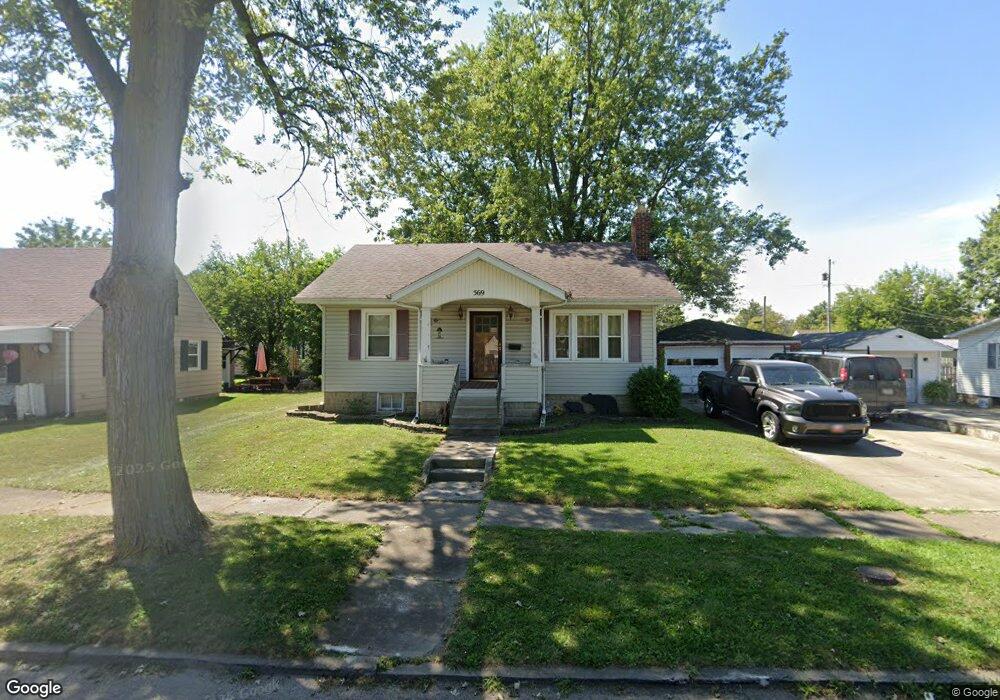
569 S Chestnut St van Wert, OH 45891
Estimated Value: $122,000 - $150,000
2
Beds
1
Bath
960
Sq Ft
$145/Sq Ft
Est. Value
About This Home
This home is located at 569 S Chestnut St, van Wert, OH 45891 and is currently estimated at $139,514, approximately $145 per square foot. 569 S Chestnut St is a home located in Van Wert County with nearby schools including Van Wert Early Childhood Center, Van Wert High School, and Lifelinks Community School.
Ownership History
Date
Name
Owned For
Owner Type
Purchase Details
Closed on
Nov 30, 2016
Sold by
Harry Schaffner
Bought by
Lehman Deborah
Current Estimated Value
Home Financials for this Owner
Home Financials are based on the most recent Mortgage that was taken out on this home.
Original Mortgage
$43,120
Outstanding Balance
$35,356
Interest Rate
4.03%
Estimated Equity
$104,158
Purchase Details
Closed on
Oct 24, 2010
Bought by
Beahrs Michael E and Beahrs Susan
Purchase Details
Closed on
Jun 29, 2005
Sold by
Beahrs Michael E and Beahrs Susan S
Bought by
Schaffner Harry A and Schaffner Kittie M
Home Financials for this Owner
Home Financials are based on the most recent Mortgage that was taken out on this home.
Original Mortgage
$51,000
Interest Rate
5.71%
Mortgage Type
Purchase Money Mortgage
Purchase Details
Closed on
Jul 29, 1997
Bought by
Bidlack Brian K
Purchase Details
Closed on
Sep 12, 1996
Bought by
Bidlack Dennis R and Bidlack Heryl
Create a Home Valuation Report for This Property
The Home Valuation Report is an in-depth analysis detailing your home's value as well as a comparison with similar homes in the area
Home Values in the Area
Average Home Value in this Area
Purchase History
| Date | Buyer | Sale Price | Title Company |
|---|---|---|---|
| Lehman Deborah | -- | -- | |
| Beahrs Michael E | $60,000 | -- | |
| Schaffner Harry A | $40,250 | None Available | |
| Bidlack Brian K | $46,000 | -- | |
| Bidlack Dennis R | $42,500 | -- |
Source: Public Records
Mortgage History
| Date | Status | Borrower | Loan Amount |
|---|---|---|---|
| Open | Lehman Deborah | $43,120 | |
| Closed | Lehman Deborah | -- | |
| Previous Owner | Schaffner Harry A | $51,000 |
Source: Public Records
Tax History Compared to Growth
Tax History
| Year | Tax Paid | Tax Assessment Tax Assessment Total Assessment is a certain percentage of the fair market value that is determined by local assessors to be the total taxable value of land and additions on the property. | Land | Improvement |
|---|---|---|---|---|
| 2024 | $1,098 | $31,480 | $4,230 | $27,250 |
| 2023 | $1,098 | $31,480 | $4,230 | $27,250 |
| 2022 | $972 | $24,230 | $2,820 | $21,410 |
| 2021 | $947 | $24,230 | $2,820 | $21,410 |
| 2020 | $945 | $24,230 | $2,820 | $21,410 |
| 2019 | $795 | $19,880 | $2,820 | $17,060 |
| 2018 | $846 | $21,790 | $2,820 | $18,970 |
| 2017 | $683 | $21,790 | $2,820 | $18,970 |
| 2016 | $807 | $21,990 | $2,820 | $19,170 |
| 2015 | $472 | $21,990 | $2,820 | $19,170 |
| 2014 | $467 | $21,990 | $2,820 | $19,170 |
| 2013 | $452 | $20,640 | $2,820 | $17,820 |
Source: Public Records
Map
Nearby Homes
- 515 S Race St
- 529 S Tyler St
- 627 S Walnut St
- 1008 Maplewood Dr
- 914 E Crawford St
- 142 E Raymond St
- 1057 Maxine Ln
- 1236 E Ervin Rd
- 1026 Elm St
- 919 E Sycamore St
- 941 Elm St
- 202 N Jefferson St
- 1060 1056 S Washington St
- 214 N Jefferson St
- 409 N Cherry St
- 133 Balyeat Ave
- 1120 Park St
- 960 Glenn St
- 517 N Walnut St
- 522 South Ave
- 563 S Chestnut St
- 717 Spencer St
- 573 S Chestnut St
- 574 S Race St
- 580 S Race St
- 568 S Race St
- 568 S Chestnut St
- 562 S Race St
- 574 S Chestnut St
- 562 S Chestnut St
- 551 S Chestnut St
- 714 Spencer St
- 556 S Chestnut St
- 700 Spencer St
- 556 S Race St
- 726 Spencer St
- 545 S Chestnut St
- 550 S Chestnut St
- 550 S Race St
- 705 Maplewood Dr