Estimated Value: $63,000 - $78,000
3
Beds
1
Bath
960
Sq Ft
$76/Sq Ft
Est. Value
About This Home
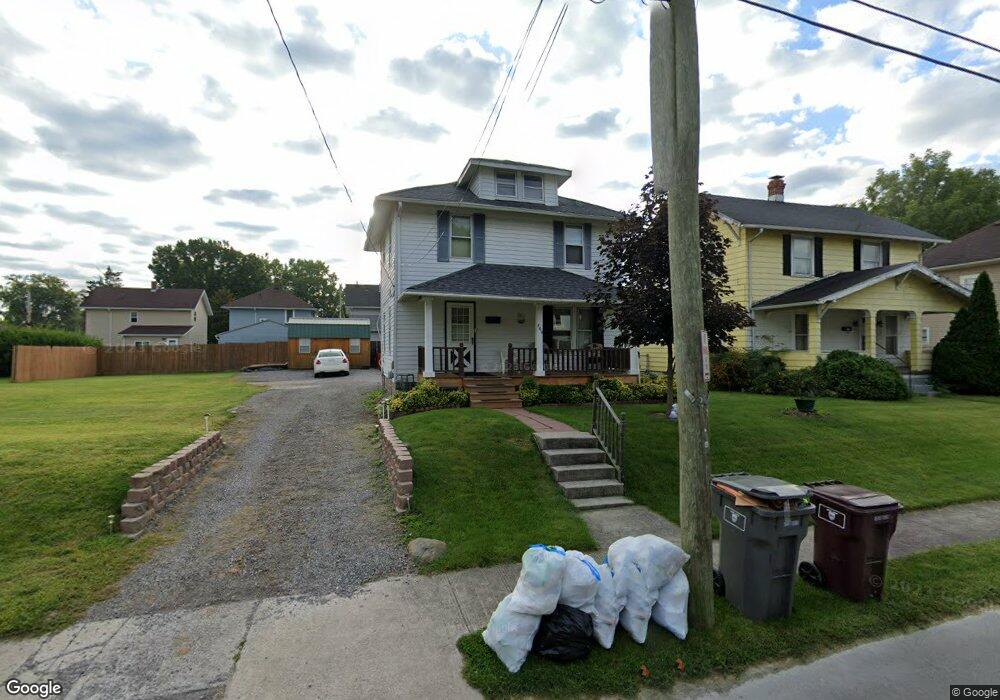
This home is located at 569 S Scott St, Lima, OH 45804 and is currently estimated at $72,667, approximately $75 per square foot. 569 S Scott St is a home located in Allen County with nearby schools including Freedom Elementary School, Lima North Middle School, and Lima West Middle School.
Ownership History
Date
Name
Owned For
Owner Type
Purchase Details
Closed on
Feb 19, 2021
Sold by
Honey Run Investments Llc
Bought by
Blue Chip Housing Llc
Current Estimated Value
Home Financials for this Owner
Home Financials are based on the most recent Mortgage that was taken out on this home.
Original Mortgage
$716,400
Outstanding Balance
$640,186
Interest Rate
2.65%
Mortgage Type
Future Advance Clause Open End Mortgage
Estimated Equity
-$567,519
Purchase Details
Closed on
Aug 14, 2018
Sold by
Sawmiller Glen C and Sawmiller Susan A
Bought by
Blue Chip Housing Llc
Purchase Details
Closed on
Nov 26, 2013
Sold by
Sawmiller Glen C and Sawmiller Susan A
Bought by
Sawmiller Glen C and Sawmiller Susan A
Purchase Details
Closed on
Nov 5, 1986
Bought by
Sawmiller Glen C and Sawmiller Susan A
Create a Home Valuation Report for This Property
The Home Valuation Report is an in-depth analysis detailing your home's value as well as a comparison with similar homes in the area
Purchase History
| Date | Buyer | Sale Price | Title Company |
|---|---|---|---|
| Blue Chip Housing Llc | $796,000 | None Available | |
| Blue Chip Housing Llc | $26,000 | None Available | |
| Sawmiller Glen C | -- | None Available | |
| Sawmiller Glen C | $15,000 | -- |
Source: Public Records
Mortgage History
| Date | Status | Borrower | Loan Amount |
|---|---|---|---|
| Open | Blue Chip Housing Llc | $716,400 |
Source: Public Records
Tax History
| Year | Tax Paid | Tax Assessment Tax Assessment Total Assessment is a certain percentage of the fair market value that is determined by local assessors to be the total taxable value of land and additions on the property. | Land | Improvement |
|---|---|---|---|---|
| 2024 | $454 | $11,030 | $810 | $10,220 |
| 2023 | $488 | $10,500 | $770 | $9,730 |
| 2022 | $540 | $10,500 | $770 | $9,730 |
| 2021 | $567 | $10,500 | $770 | $9,730 |
| 2020 | $443 | $7,810 | $770 | $7,040 |
| 2019 | $443 | $7,810 | $770 | $7,040 |
| 2018 | $429 | $7,810 | $770 | $7,040 |
| 2017 | $434 | $7,810 | $770 | $7,040 |
| 2016 | $441 | $7,810 | $770 | $7,040 |
| 2015 | $520 | $7,810 | $770 | $7,040 |
| 2014 | $520 | $9,350 | $810 | $8,540 |
| 2013 | $507 | $9,350 | $810 | $8,540 |
Source: Public Records
Map
Nearby Homes
- 520 Orena Ave
- 546 Orena Ave
- 653 S Scott St
- 629 Harrison Ave
- 717 E Kibby St
- 617 E Kibby St
- 817 E Eureka St
- 621 Prospect Ave
- 706 E Kibby St
- 610 Linden St
- 717 E Albert St
- 00 E Albert St
- 544 S Pine St
- 818 Madison Ave
- 504 S Shawnee St
- 145 S Pine St
- 806 Bellefontaine Ave
- 725 E Vine St
- 801 E Vine St
- 129 S Pine St
Your Personal Tour Guide
Ask me questions while you tour the home.