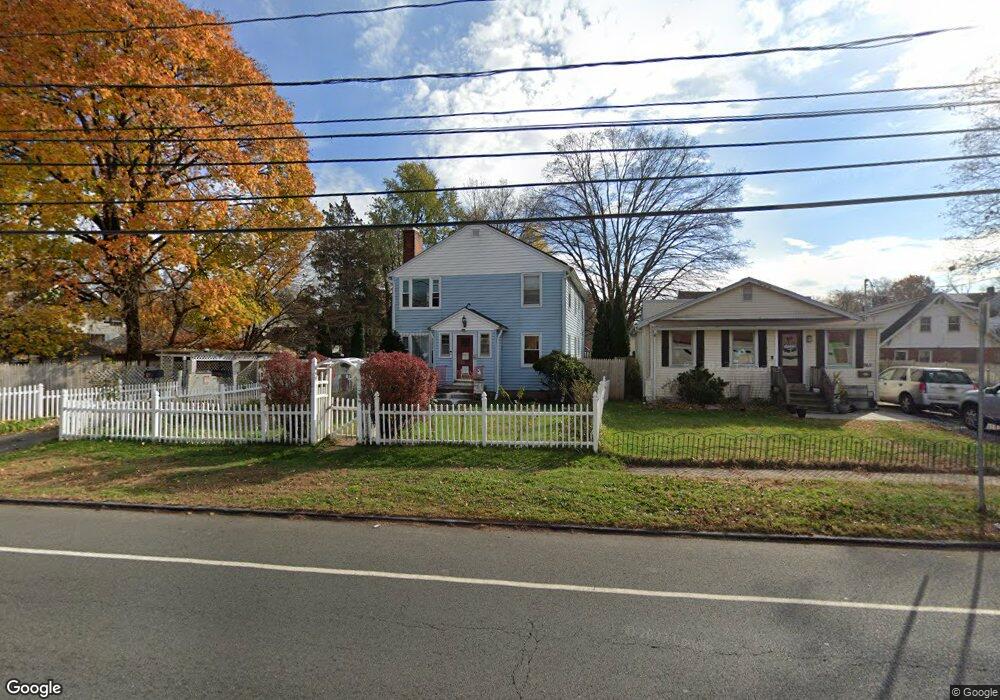
569 Tolland St East Hartford, CT 06108
Estimated Value: $346,000 - $402,000
6
Beds
2
Baths
2,324
Sq Ft
$160/Sq Ft
Est. Value
About This Home
This home is located at 569 Tolland St, East Hartford, CT 06108 and is currently estimated at $372,147, approximately $160 per square foot. 569 Tolland St is a home located in Hartford County with nearby schools including Dr. John A. Langford School, East Hartford Middle School, and East Hartford High School.
Ownership History
Date
Name
Owned For
Owner Type
Purchase Details
Closed on
Jul 26, 2013
Sold by
Nasse Emily
Bought by
Nasse Bledar K
Current Estimated Value
Purchase Details
Closed on
Feb 1, 2000
Sold by
Thibodeau Donald and Thibodeau Patrica
Bought by
Nasse Bledar K
Purchase Details
Closed on
Sep 3, 1987
Sold by
Thibodeau Wilfred
Bought by
Thibodeau Donald
Create a Home Valuation Report for This Property
The Home Valuation Report is an in-depth analysis detailing your home's value as well as a comparison with similar homes in the area
Home Values in the Area
Average Home Value in this Area
Purchase History
| Date | Buyer | Sale Price | Title Company |
|---|---|---|---|
| Nasse Bledar K | -- | -- | |
| Nasse Bledar K | $145,000 | -- | |
| Thibodeau Donald | $155,000 | -- |
Source: Public Records
Mortgage History
| Date | Status | Borrower | Loan Amount |
|---|---|---|---|
| Open | Thibodeau Donald | $215,953 | |
| Previous Owner | Thibodeau Donald | $20,000 | |
| Previous Owner | Thibodeau Donald | $165,000 |
Source: Public Records
Tax History Compared to Growth
Tax History
| Year | Tax Paid | Tax Assessment Tax Assessment Total Assessment is a certain percentage of the fair market value that is determined by local assessors to be the total taxable value of land and additions on the property. | Land | Improvement |
|---|---|---|---|---|
| 2025 | $8,323 | $181,330 | $44,660 | $136,670 |
| 2024 | $7,979 | $181,330 | $44,660 | $136,670 |
| 2023 | $7,714 | $181,330 | $44,660 | $136,670 |
| 2022 | $7,435 | $181,330 | $44,660 | $136,670 |
| 2021 | $6,024 | $122,070 | $27,390 | $94,680 |
| 2020 | $6,094 | $122,070 | $27,390 | $94,680 |
| 2019 | $5,995 | $122,070 | $27,390 | $94,680 |
| 2018 | $5,818 | $122,070 | $27,390 | $94,680 |
| 2017 | $5,743 | $122,070 | $27,390 | $94,680 |
| 2016 | $5,586 | $121,800 | $27,390 | $94,410 |
| 2015 | $5,586 | $121,800 | $27,390 | $94,410 |
| 2014 | $5,530 | $121,800 | $27,390 | $94,410 |
Source: Public Records
Map
Nearby Homes
- 73 Bliss St
- 421 Tolland St Unit 209
- 3 Price Ct
- 22 Matthew Rd
- 89 Henderson Dr
- 15 Michael Ave
- 8 Howard Ct Unit 10
- 2 Cottage St
- 4 Cottage St
- 506 Burnside Ave
- 509 Burnside Ave Unit A18
- 26 Casabella Cir Unit 28
- 51 Daniel St
- 116 Michael Ave Unit 118
- 577 Goodwin St
- 453 Burnside Ave
- 345 Goodwin St
- 32 Columbus St
- 29 Joanne Dr Unit 29
- 0 Hillside Ave
- 569 Tolland St Unit 2
- 569 Tolland St Unit 1
- 565 Tolland St
- 85 William St
- 83 William St
- 76 Hanmer St
- 73 William St
- 68 Hanmer St
- 71 William St
- 553 Tolland St
- 555 Tolland St Unit A
- 73 Hanmer St
- 74 Hanmer St
- 549 Tolland St
- 547 Tolland St
- 65 Hanmer St Unit 67
- 65 William St
- 80 William St
- 56 Hanmer St
- 76 William St Unit 78