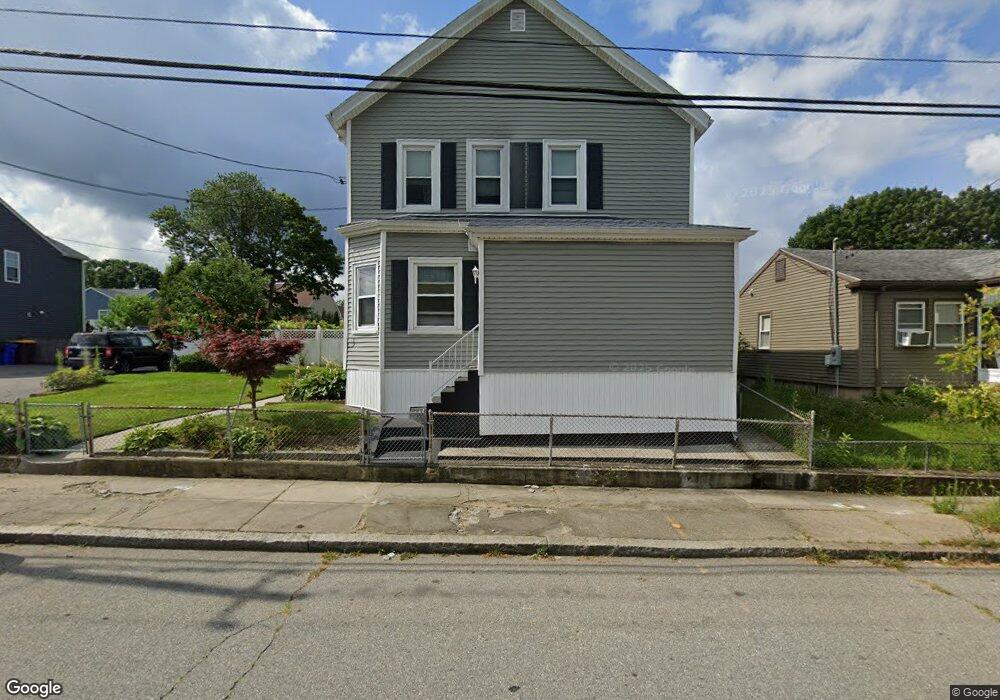
569 Tucker St Fall River, MA 02721
Maplewood NeighborhoodEstimated Value: $477,000 - $564,000
9
Beds
2
Baths
2,360
Sq Ft
$213/Sq Ft
Est. Value
About This Home
This home is located at 569 Tucker St, Fall River, MA 02721 and is currently estimated at $503,435, approximately $213 per square foot. 569 Tucker St is a home located in Bristol County with nearby schools including Letourneau Elementary School, Matthew J. Kuss Middle School, and B M C Durfee High School.
Ownership History
Date
Name
Owned For
Owner Type
Purchase Details
Closed on
May 24, 2018
Sold by
Ferreira Maria C and Ferreira Jose
Bought by
Ferreira 2018 Irt
Current Estimated Value
Purchase Details
Closed on
Nov 10, 1998
Sold by
Desmarais Mark and Pelletier Kathleen M
Bought by
Ferreira Jose and Ferreira Maria C
Home Financials for this Owner
Home Financials are based on the most recent Mortgage that was taken out on this home.
Original Mortgage
$107,000
Interest Rate
6.64%
Mortgage Type
Purchase Money Mortgage
Purchase Details
Closed on
Jun 3, 1993
Sold by
Craveiro Elizabeth and Littman Kenneth G
Bought by
Desmarais Mark and Pelletier Kathleen
Home Financials for this Owner
Home Financials are based on the most recent Mortgage that was taken out on this home.
Original Mortgage
$111,035
Interest Rate
7.33%
Mortgage Type
Purchase Money Mortgage
Create a Home Valuation Report for This Property
The Home Valuation Report is an in-depth analysis detailing your home's value as well as a comparison with similar homes in the area
Home Values in the Area
Average Home Value in this Area
Purchase History
| Date | Buyer | Sale Price | Title Company |
|---|---|---|---|
| Ferreira 2018 Irt | -- | -- | |
| Ferreira Jose | $140,000 | -- | |
| Desmarais Mark | $90,000 | -- |
Source: Public Records
Mortgage History
| Date | Status | Borrower | Loan Amount |
|---|---|---|---|
| Previous Owner | Desmarais Mark | $107,000 | |
| Previous Owner | Desmarais Mark | $111,035 | |
| Previous Owner | Desmarais Mark | $22,500 | |
| Previous Owner | Desmarais Mark | $15,000 |
Source: Public Records
Tax History Compared to Growth
Tax History
| Year | Tax Paid | Tax Assessment Tax Assessment Total Assessment is a certain percentage of the fair market value that is determined by local assessors to be the total taxable value of land and additions on the property. | Land | Improvement |
|---|---|---|---|---|
| 2025 | $4,909 | $428,700 | $128,900 | $299,800 |
| 2024 | $4,502 | $391,800 | $124,000 | $267,800 |
| 2023 | $4,063 | $331,100 | $106,300 | $224,800 |
| 2022 | $3,728 | $295,400 | $96,600 | $198,800 |
| 2021 | $3,456 | $249,900 | $89,400 | $160,500 |
| 2020 | $3,108 | $215,100 | $85,600 | $129,500 |
| 2019 | $2,932 | $201,100 | $81,500 | $119,600 |
| 2018 | $2,706 | $185,100 | $80,000 | $105,100 |
| 2017 | $2,444 | $174,600 | $81,600 | $93,000 |
| 2016 | $2,395 | $175,700 | $85,000 | $90,700 |
| 2015 | $2,256 | $172,500 | $81,800 | $90,700 |
| 2014 | $2,324 | $184,700 | $86,100 | $98,600 |
Source: Public Records
Map
Nearby Homes
- 478 Tucker St
- 125 Carl St
- 539 Aetna St
- 59 Wayne St
- 256 Rhode Island Ave
- 415 Anthony St
- 80 Lane St
- 323 S Oxford St
- 59 Denver St
- 495 Chicago St
- 1441 Stafford Rd
- 191 Glasgow St Unit 2
- 191 Glasgow St Unit 1
- 352 Vale St Unit 1
- 306 Mott St
- 340 Vale St
- 239 Glasgow St Unit 8
- 493 Peckham St
- 54 Grinnell St
- 215 Cambridge St