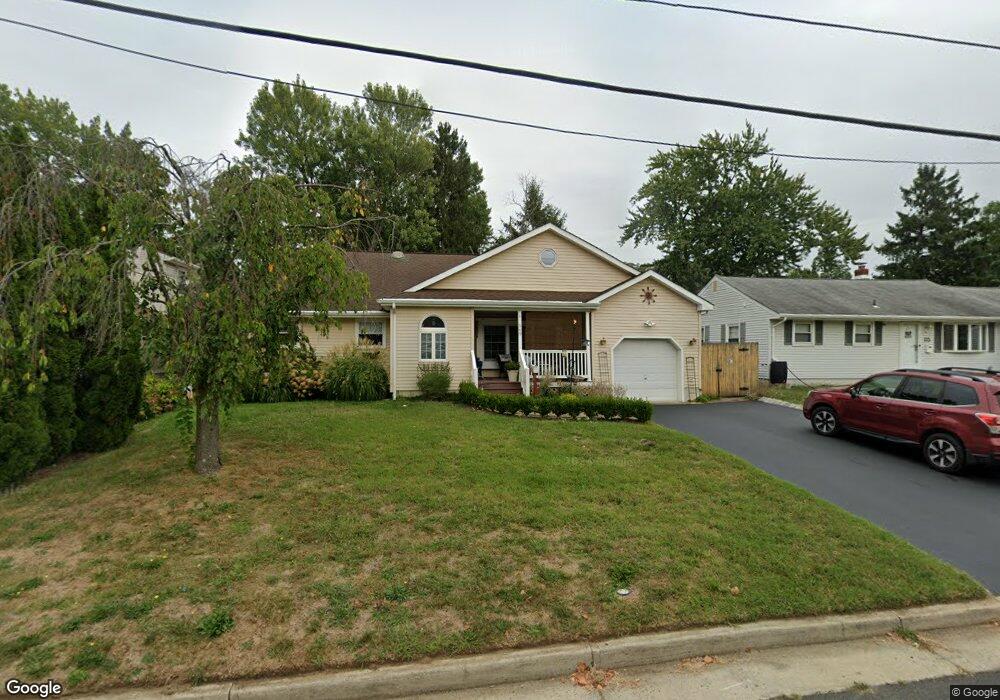
569 Turner Dr Belford, NJ 07718
New Monmouth NeighborhoodEstimated Value: $572,000 - $609,285
3
Beds
2
Baths
1,728
Sq Ft
$339/Sq Ft
Est. Value
About This Home
This home is located at 569 Turner Dr, Belford, NJ 07718 and is currently estimated at $586,321, approximately $339 per square foot. 569 Turner Dr is a home located in Monmouth County with nearby schools including Bayview Elementary School, Bayshore Middle School, and Middletown High School North.
Ownership History
Date
Name
Owned For
Owner Type
Purchase Details
Closed on
Jun 8, 2000
Sold by
Mccarthy Michael
Bought by
Corin Robert and Davatelis Mariann
Current Estimated Value
Home Financials for this Owner
Home Financials are based on the most recent Mortgage that was taken out on this home.
Original Mortgage
$152,100
Outstanding Balance
$53,239
Interest Rate
8.12%
Estimated Equity
$533,082
Purchase Details
Closed on
Sep 15, 1995
Sold by
Westlake James
Bought by
Mccarthy Michael and Mccarthy Christin
Home Financials for this Owner
Home Financials are based on the most recent Mortgage that was taken out on this home.
Original Mortgage
$95,000
Interest Rate
7.81%
Create a Home Valuation Report for This Property
The Home Valuation Report is an in-depth analysis detailing your home's value as well as a comparison with similar homes in the area
Home Values in the Area
Average Home Value in this Area
Purchase History
| Date | Buyer | Sale Price | Title Company |
|---|---|---|---|
| Corin Robert | $169,900 | -- | |
| Mccarthy Michael | $127,000 | -- |
Source: Public Records
Mortgage History
| Date | Status | Borrower | Loan Amount |
|---|---|---|---|
| Open | Corin Robert | $152,100 | |
| Previous Owner | Mccarthy Michael | $95,000 |
Source: Public Records
Tax History Compared to Growth
Tax History
| Year | Tax Paid | Tax Assessment Tax Assessment Total Assessment is a certain percentage of the fair market value that is determined by local assessors to be the total taxable value of land and additions on the property. | Land | Improvement |
|---|---|---|---|---|
| 2025 | $7,903 | $552,200 | $349,500 | $202,700 |
| 2024 | $8,464 | $480,400 | $281,500 | $198,900 |
| 2023 | $8,464 | $487,000 | $277,300 | $209,700 |
| 2022 | $7,424 | $433,400 | $236,700 | $196,700 |
| 2021 | $7,424 | $356,900 | $181,900 | $175,000 |
| 2020 | $7,498 | $350,700 | $179,700 | $171,000 |
| 2019 | $7,386 | $349,700 | $179,700 | $170,000 |
| 2018 | $6,791 | $313,400 | $151,300 | $162,100 |
| 2017 | $6,799 | $310,600 | $151,300 | $159,300 |
| 2016 | $6,382 | $299,500 | $141,300 | $158,200 |
| 2015 | $6,555 | $297,000 | $141,300 | $155,700 |
| 2014 | $6,418 | $283,600 | $141,300 | $142,300 |
Source: Public Records
Map
Nearby Homes