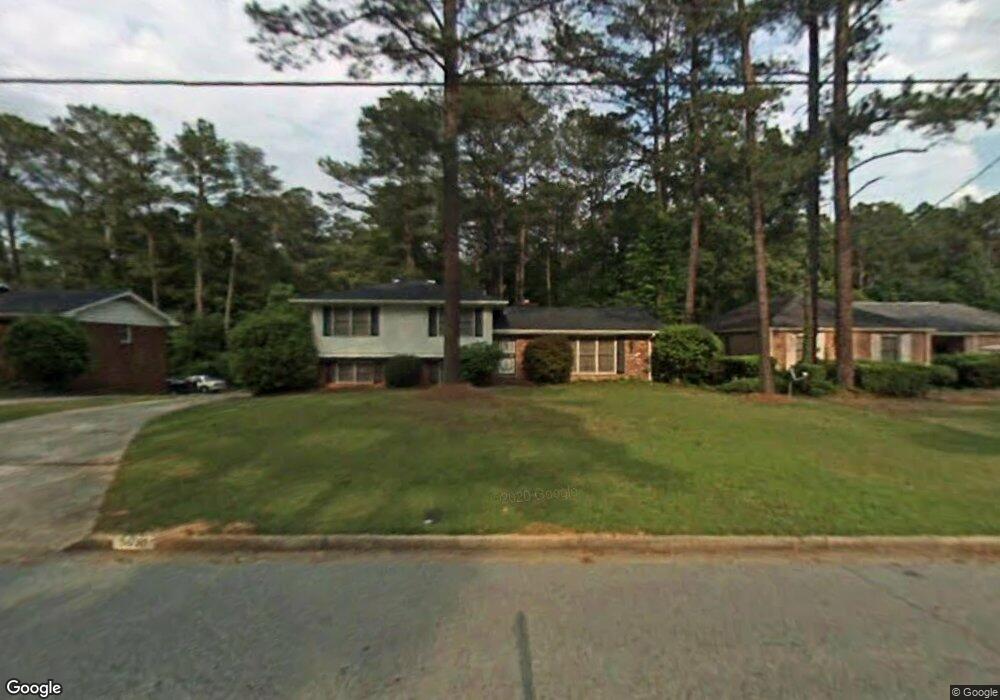
5690 Orly Terrace Atlanta, GA 30349
Estimated Value: $220,000 - $247,000
3
Beds
2
Baths
1,642
Sq Ft
$144/Sq Ft
Est. Value
About This Home
This home is located at 5690 Orly Terrace, Atlanta, GA 30349 and is currently estimated at $237,032, approximately $144 per square foot. 5690 Orly Terrace is a home located in Fulton County with nearby schools including Heritage Elementary School, Woodland Middle School, and Banneker High School.
Ownership History
Date
Name
Owned For
Owner Type
Purchase Details
Closed on
May 29, 2020
Sold by
Ponder Reginal
Bought by
Mayner Adrian Monish
Current Estimated Value
Home Financials for this Owner
Home Financials are based on the most recent Mortgage that was taken out on this home.
Original Mortgage
$63,050
Outstanding Balance
$55,889
Interest Rate
3.2%
Mortgage Type
New Conventional
Estimated Equity
$181,143
Purchase Details
Closed on
May 26, 2011
Sold by
Ponder Reginald and Ponder Sharon
Bought by
Lch Atlanta Llc
Purchase Details
Closed on
Apr 5, 2011
Sold by
Dennis Donald and Dennis Jacqueline
Bought by
Lch Atlanta Llc
Purchase Details
Closed on
Jan 16, 2001
Sold by
Boykin Melvin A
Bought by
Dennis Donald and Dennis Jacqueline
Home Financials for this Owner
Home Financials are based on the most recent Mortgage that was taken out on this home.
Original Mortgage
$120,000
Interest Rate
7.44%
Mortgage Type
New Conventional
Create a Home Valuation Report for This Property
The Home Valuation Report is an in-depth analysis detailing your home's value as well as a comparison with similar homes in the area
Home Values in the Area
Average Home Value in this Area
Purchase History
| Date | Buyer | Sale Price | Title Company |
|---|---|---|---|
| Mayner Adrian Monish | $65,000 | -- | |
| Lch Atlanta Llc | $51,000 | -- | |
| Lch Atlanta Llc | $21,401 | -- | |
| Dennis Donald | $120,000 | -- |
Source: Public Records
Mortgage History
| Date | Status | Borrower | Loan Amount |
|---|---|---|---|
| Open | Mayner Adrian Monish | $63,050 | |
| Previous Owner | Dennis Donald | $120,000 |
Source: Public Records
Tax History Compared to Growth
Tax History
| Year | Tax Paid | Tax Assessment Tax Assessment Total Assessment is a certain percentage of the fair market value that is determined by local assessors to be the total taxable value of land and additions on the property. | Land | Improvement |
|---|---|---|---|---|
| 2025 | $1,052 | $84,840 | $22,160 | $62,680 |
| 2023 | $2,747 | $97,320 | $27,520 | $69,800 |
| 2022 | $964 | $68,200 | $14,800 | $53,400 |
| 2021 | $930 | $41,680 | $10,960 | $30,720 |
| 2020 | $1,659 | $40,760 | $8,120 | $32,640 |
| 2019 | $945 | $23,920 | $2,440 | $21,480 |
| 2018 | $931 | $23,400 | $2,400 | $21,000 |
| 2017 | $828 | $20,320 | $3,080 | $17,240 |
| 2016 | $828 | $20,320 | $3,080 | $17,240 |
| 2015 | $831 | $20,320 | $3,080 | $17,240 |
| 2014 | $478 | $11,080 | $2,320 | $8,760 |
Source: Public Records
Map
Nearby Homes
- 300 Fox Trail Dr
- 2039 Faith Cove
- 2050 Surrey Trail
- 1125 Knight Ct
- 5520 Saint lo Ln
- 5337 Chantilly Terrace
- 2270 Britley Terrace Unit 2
- 1947 Eshelman Ct
- 5324 Joan of Arc Place
- 5411 Louis XIV Ln
- 5400 Louis XIV Ln
- 5312 Joan of Arc Place
- 5854 El Segundo Way
- 1853 Broad River Rd
- 5287 Chantilly Terrace
- 5950 Milligan Ct
- 1969 Banks Way
- 5316 the Savoy St
- 1615 Potomac Ct
- 5243 Joan of Arc Place
- 5680 Orly Terrace
- 5700 Orly Terrace Unit 9
- 5670 Orly Terrace
- 5710 Orly Terrace
- 5685 Orly Terrace
- 5675 Orly Terrace
- 5695 Orly Terrace Unit 9
- 5660 Orly Terrace
- 5720 Orly Terrace
- 5665 Orly Terrace
- 5705 Orly Terrace
- 5655 Orly Terrace
- 5650 Orly Terrace
- 5715 Orly Terrace
- 5730 Orly Terrace
- 395 Fox Trail Dr
- 5445 Denny Dr
- 400 Fox Trail Dr
- 385 Fox Trail Dr