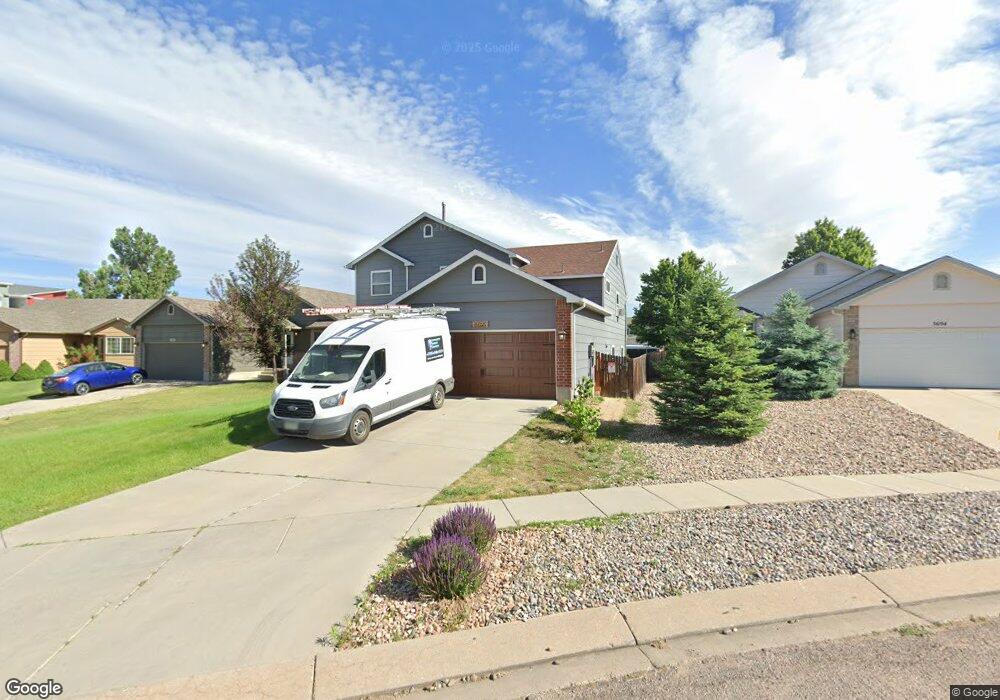
5690 Vermillion Bluffs Dr Colorado Springs, CO 80923
Ridgeview NeighborhoodEstimated Value: $449,137 - $473,000
3
Beds
3
Baths
1,912
Sq Ft
$244/Sq Ft
Est. Value
About This Home
This home is located at 5690 Vermillion Bluffs Dr, Colorado Springs, CO 80923 and is currently estimated at $466,284, approximately $243 per square foot. 5690 Vermillion Bluffs Dr is a home located in El Paso County with nearby schools including Ridgeview Elementary School, Skyview Middle School, and Vista Ridge High School.
Ownership History
Date
Name
Owned For
Owner Type
Purchase Details
Closed on
Oct 22, 2007
Sold by
Armijo James C and Armijo Tanya M
Bought by
Mcclure Janie A
Current Estimated Value
Home Financials for this Owner
Home Financials are based on the most recent Mortgage that was taken out on this home.
Original Mortgage
$216,600
Outstanding Balance
$135,996
Interest Rate
6.32%
Mortgage Type
Unknown
Estimated Equity
$330,288
Purchase Details
Closed on
Oct 22, 2003
Sold by
Tollefson Jess A and Tollefson Laura L
Bought by
Armijo James C and Armijo Tanya M
Home Financials for this Owner
Home Financials are based on the most recent Mortgage that was taken out on this home.
Original Mortgage
$197,013
Interest Rate
5.99%
Mortgage Type
FHA
Purchase Details
Closed on
May 30, 2002
Sold by
Melody Homes Inc
Bought by
Tollefson Jess A and Tollefson Laura L
Home Financials for this Owner
Home Financials are based on the most recent Mortgage that was taken out on this home.
Original Mortgage
$160,776
Interest Rate
6.89%
Mortgage Type
FHA
Create a Home Valuation Report for This Property
The Home Valuation Report is an in-depth analysis detailing your home's value as well as a comparison with similar homes in the area
Home Values in the Area
Average Home Value in this Area
Purchase History
| Date | Buyer | Sale Price | Title Company |
|---|---|---|---|
| Mcclure Janie A | $228,000 | Title America | |
| Armijo James C | $199,000 | Stewart Title | |
| Tollefson Jess A | $198,052 | Land Title |
Source: Public Records
Mortgage History
| Date | Status | Borrower | Loan Amount |
|---|---|---|---|
| Open | Mcclure Janie A | $216,600 | |
| Previous Owner | Armijo James C | $197,013 | |
| Previous Owner | Tollefson Jess A | $160,776 |
Source: Public Records
Tax History Compared to Growth
Tax History
| Year | Tax Paid | Tax Assessment Tax Assessment Total Assessment is a certain percentage of the fair market value that is determined by local assessors to be the total taxable value of land and additions on the property. | Land | Improvement |
|---|---|---|---|---|
| 2025 | $1,732 | $32,940 | -- | -- |
| 2024 | $1,633 | $32,980 | $4,620 | $28,360 |
| 2023 | $1,633 | $32,980 | $4,620 | $28,360 |
| 2022 | $1,373 | $23,550 | $4,170 | $19,380 |
| 2021 | $1,431 | $24,230 | $4,290 | $19,940 |
| 2020 | $1,288 | $21,550 | $3,580 | $17,970 |
| 2019 | $1,274 | $21,550 | $3,580 | $17,970 |
| 2018 | $1,065 | $17,650 | $3,020 | $14,630 |
| 2017 | $1,070 | $17,650 | $3,020 | $14,630 |
| 2016 | $1,076 | $17,490 | $2,950 | $14,540 |
| 2015 | $1,077 | $17,490 | $2,950 | $14,540 |
| 2014 | $1,020 | $16,240 | $2,790 | $13,450 |
Source: Public Records
Map
Nearby Homes
- 5969 Chorus Heights
- 5742 Charlotte Pkwy
- 5655 Mesa Mountain Way
- 7143 Hunter Jumper Dr
- 5639 Mesa Mountain Way
- 6239 Hartman Dr
- 5868 Poudre Way
- 6612 La Plata Peak Dr
- 5639 Sunshade Point
- 6041 Chivalry Dr
- 6105 New Colt Grove
- 6323 Galeta Dr
- 5340 Slickrock Dr
- 5618 Tomiche Dr
- 6460 Lasso Grande Point
- 5808 Granby Hill Dr
- 6853 Summer Grace St
- The Elbert Plan at Ascent at Woodmen Heights
- The Gladstone Plan at Ascent at Woodmen Heights
- The Belford Plan at Ascent at Woodmen Heights
- 5686 Vermillion Bluffs Dr
- 5694 Vermillion Bluffs Dr
- 6165 Lantana Light View
- 6177 Lantana Light View
- 5698 Vermillion Bluffs Dr
- 5682 Vermillion Bluffs Dr
- 5702 Vermillion Bluffs Dr
- 5805 Woodwind Grove
- 5874 Ensemble Heights
- 5695 Vermillion Bluffs Dr
- 5815 Woodwind Grove
- 5882 Ensemble Heights
- 5679 Vermillion Bluffs Dr
- 5825 Woodwind Grove
- 5842 Ensemble Heights
- 5706 Vermillion Bluffs Dr
- 5890 Ensemble Heights
- 5865 Ensemble Heights
- 5834 Ensemble Heights
- 5699 Vermillion Bluffs Dr