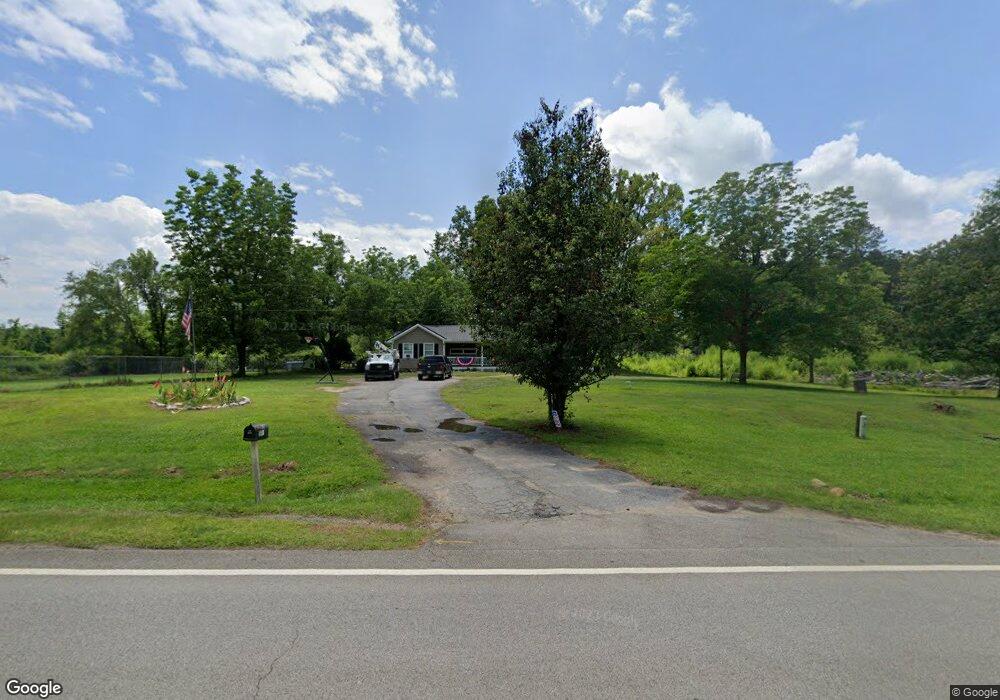
5691 Union Point Hwy Union Point, GA 30669
Estimated Value: $239,000 - $416,643
4
Beds
3
Baths
1,152
Sq Ft
$288/Sq Ft
Est. Value
About This Home
This home is located at 5691 Union Point Hwy, Union Point, GA 30669 and is currently estimated at $332,161, approximately $288 per square foot. 5691 Union Point Hwy is a home located in Greene County with nearby schools including Greene County High School.
Ownership History
Date
Name
Owned For
Owner Type
Purchase Details
Closed on
Jul 25, 2017
Sold by
Tiffany M
Bought by
Lindsey Joshua Q
Current Estimated Value
Purchase Details
Closed on
May 6, 2011
Sold by
Federal National Mortgage Association
Bought by
Lindsey Josh and Lindsey Tiffany
Home Financials for this Owner
Home Financials are based on the most recent Mortgage that was taken out on this home.
Original Mortgage
$90,210
Interest Rate
4.85%
Mortgage Type
New Conventional
Purchase Details
Closed on
Aug 3, 2010
Sold by
Ixis Real Estate Capital Inc
Bought by
Federal National Mortgage Association
Purchase Details
Closed on
Sep 23, 2005
Sold by
Davis Karen L
Bought by
Villela Miguel A
Home Financials for this Owner
Home Financials are based on the most recent Mortgage that was taken out on this home.
Original Mortgage
$109,276
Interest Rate
5.72%
Mortgage Type
New Conventional
Purchase Details
Closed on
Jan 1, 1955
Bought by
Lunceford John D
Create a Home Valuation Report for This Property
The Home Valuation Report is an in-depth analysis detailing your home's value as well as a comparison with similar homes in the area
Home Values in the Area
Average Home Value in this Area
Purchase History
| Date | Buyer | Sale Price | Title Company |
|---|---|---|---|
| Lindsey Joshua Q | -- | -- | |
| Lindsey Josh | $93,000 | -- | |
| Federal National Mortgage Association | $112,352 | -- | |
| Ixix Real Estate Capital Inc | $112,352 | -- | |
| Villela Miguel A | $136,595 | -- | |
| Davis Karen L | -- | -- | |
| Lunceford John D | -- | -- |
Source: Public Records
Mortgage History
| Date | Status | Borrower | Loan Amount |
|---|---|---|---|
| Previous Owner | Lindsey Josh | $90,210 | |
| Previous Owner | Davis Karen L | $109,276 | |
| Previous Owner | Villela Miguel A | $27,319 |
Source: Public Records
Tax History Compared to Growth
Tax History
| Year | Tax Paid | Tax Assessment Tax Assessment Total Assessment is a certain percentage of the fair market value that is determined by local assessors to be the total taxable value of land and additions on the property. | Land | Improvement |
|---|---|---|---|---|
| 2025 | $1,067 | $144,624 | $40,560 | $104,064 |
| 2024 | $1,149 | $137,264 | $40,560 | $96,704 |
| 2023 | $772 | $123,320 | $31,440 | $91,880 |
| 2022 | $1,003 | $89,632 | $24,160 | $65,472 |
| 2021 | $1,058 | $82,552 | $24,160 | $58,392 |
| 2020 | $1,052 | $43,828 | $17,960 | $25,868 |
| 2019 | $1,083 | $43,828 | $17,960 | $25,868 |
| 2018 | $1,061 | $43,828 | $17,960 | $25,868 |
| 2017 | $1,000 | $43,891 | $17,973 | $25,918 |
| 2016 | $1,011 | $45,105 | $17,973 | $27,132 |
| 2015 | $842 | $38,053 | $17,973 | $20,080 |
| 2014 | $837 | $36,162 | $17,973 | $18,189 |
Source: Public Records
Map
Nearby Homes
- 1201 Buffalo Lick Rd
- 0 Buffalo Lick Rd Unit 10551234
- 0 Buffalo Lick Rd Unit 10551325
- 5401 Union Point Hwy
- 112 Hendry St
- 1041 Hillcrest Dr
- 0 Woodland Ct Unit 10543600
- 202 Veazey St
- 1241 Old Siloam Rd
- 1581 Highway 77 S
- 324 N Rhodes St
- 1581 Highway 77 S Hwy
- 1860 Washington Hwy
- 215 Hunter St
- 0 S Rhodes St Unit 10618488
- 0 Washington Hwy Unit 7276060
- 1251 Brick House Rd
- 1251 Brickhouse Rd
- 0 Old Union Point Rd Unit 1 10557753
- 1251 Adams Rd
- 5771 Union Point Hwy
- 0 Buffalo Lick Rd Unit 10551328
- 0 Buffalo Lick Rd Unit 10445780
- 0 Buffalo Lick Rd Unit 10339030
- 0 Buffalo Lick Rd Unit 20164420
- 0 Buffalo Lick Rd Unit 20136813
- 0 Buffalo Lick Rd Unit 20136680
- 0 Buffalo Lick Rd Unit 10183736
- 0 Buffalo Lick Rd Unit 8877389
- Buffalo Li Buffalo Lick Rd
- 1101 Buffalo Lick Rd
- Buff Buffalo Lick Rd
- 1301 Buffalo Lick Rd
- 5791 Union Point Hwy
- 5800 Union Point Hwy
- 1 Union Point Hwy
- 5830 Union Point Hwy
- 5901 Union Point Hwy
- 5391 Union Point Hwy
- 5341 Union Point Hwy