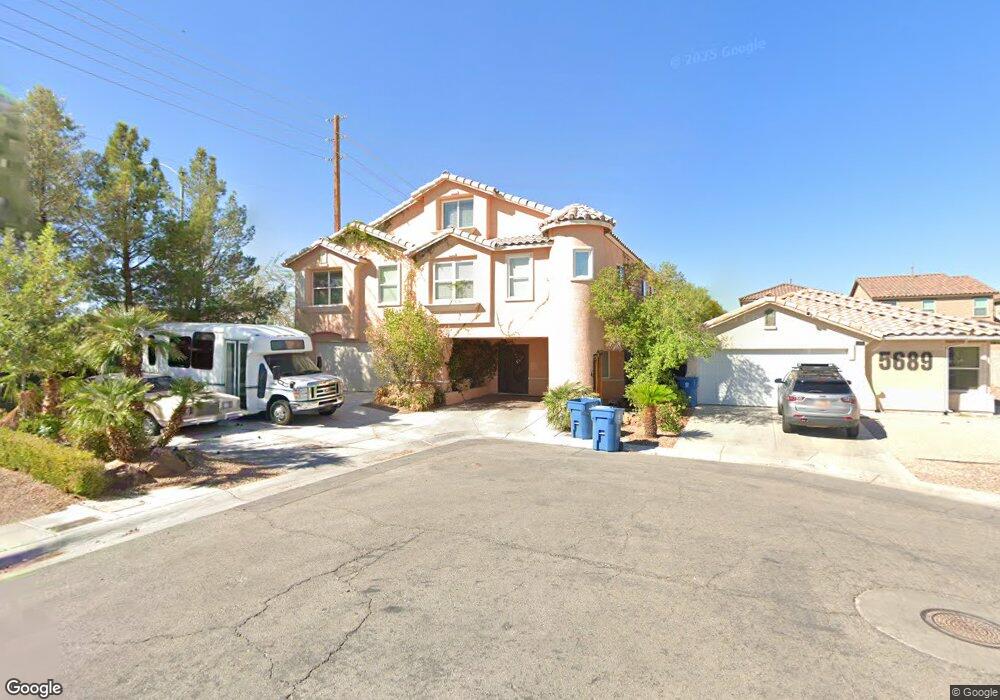
5695 Juno Ct Unit 3 Las Vegas, NV 89118
Estimated Value: $454,000 - $1,305,000
7
Beds
9
Baths
5,947
Sq Ft
$152/Sq Ft
Est. Value
About This Home
This home is located at 5695 Juno Ct Unit 3, Las Vegas, NV 89118 and is currently estimated at $903,117, approximately $151 per square foot. 5695 Juno Ct Unit 3 is a home located in Clark County with nearby schools including Helen Jydstrup Elementary School, Grant Sawyer Middle School, and Durango High School.
Ownership History
Date
Name
Owned For
Owner Type
Purchase Details
Closed on
Oct 23, 2019
Sold by
Morales Victor and Morales Victor H
Bought by
Morales Victor
Current Estimated Value
Home Financials for this Owner
Home Financials are based on the most recent Mortgage that was taken out on this home.
Original Mortgage
$199,500
Outstanding Balance
$133,002
Interest Rate
3.5%
Mortgage Type
New Conventional
Estimated Equity
$770,115
Purchase Details
Closed on
Jul 11, 2018
Sold by
Morales Stephanie Lissette
Bought by
Morales Victor H
Purchase Details
Closed on
Jun 15, 2014
Sold by
Morales Victor H
Bought by
Morales Stephanie Lissette
Purchase Details
Closed on
Feb 5, 2002
Sold by
Kb Home Nevada Inc
Bought by
Morales Victor H
Home Financials for this Owner
Home Financials are based on the most recent Mortgage that was taken out on this home.
Original Mortgage
$155,200
Interest Rate
7.15%
Create a Home Valuation Report for This Property
The Home Valuation Report is an in-depth analysis detailing your home's value as well as a comparison with similar homes in the area
Home Values in the Area
Average Home Value in this Area
Purchase History
| Date | Buyer | Sale Price | Title Company |
|---|---|---|---|
| Morales Victor | -- | First American Title | |
| Morales Victor H | -- | None Available | |
| Morales Stephanie Lissette | -- | None Available | |
| Morales Victor H | $163,375 | First American Title Co |
Source: Public Records
Mortgage History
| Date | Status | Borrower | Loan Amount |
|---|---|---|---|
| Open | Morales Victor | $199,500 | |
| Closed | Morales Victor H | $155,200 |
Source: Public Records
Tax History Compared to Growth
Tax History
| Year | Tax Paid | Tax Assessment Tax Assessment Total Assessment is a certain percentage of the fair market value that is determined by local assessors to be the total taxable value of land and additions on the property. | Land | Improvement |
|---|---|---|---|---|
| 2025 | $7,156 | $270,531 | $30,800 | $239,731 |
| 2024 | $6,680 | $270,531 | $30,800 | $239,731 |
| 2023 | $4,489 | $256,795 | $30,800 | $225,995 |
| 2022 | $6,442 | $231,170 | $25,200 | $205,970 |
| 2021 | $5,682 | $219,591 | $24,150 | $195,441 |
| 2020 | $5,273 | $214,978 | $21,700 | $193,278 |
| 2019 | $4,942 | $209,147 | $19,250 | $189,897 |
| 2018 | $4,798 | $196,568 | $15,400 | $181,168 |
| 2017 | $5,797 | $197,661 | $14,350 | $183,311 |
| 2016 | $4,489 | $202,896 | $11,550 | $191,346 |
| 2015 | $4,482 | $175,556 | $7,000 | $168,556 |
| 2014 | $4,343 | $143,665 | $7,000 | $136,665 |
Source: Public Records
Map
Nearby Homes
- 5565 Autumn Cliffs Way
- 5607 W Dewey Dr
- 5877 Capsicum Ct
- 5691 Leaning Oak Ave
- 6012 Prospector Trail
- 5354 Silver Branch Ave
- 5876 Pack Trail
- 5332 Chili Pepper St
- 5508 Ness Ave
- 5642 Deer Creek Falls Ct
- 5266 Tropical Peach Dr
- 5568 Yellow Ash St
- 5273 Wave Dancer Ln
- 5266 Souvenir Ln
- 5603 Deer Creek Falls Ct
- 5770 El Camino Rd
- 0 W Patrick Ln Unit 2718906
- 5221 Lindell Rd Unit 202
- 5221 Lindell Rd Unit 206
- 5240 Island Chain Rd
- 5689 Juno Ct
- 5683 Juno Ct
- 5688 Autumn Cliffs Way
- 5694 Autumn Cliffs Way
- 5682 Autumn Cliffs Way
- 5694 Juno Ct
- 5676 Autumn Cliffs Way
- 5677 Juno Ct
- 5677 Juno Ct Unit n/a
- 5688 Juno Ct
- 5670 Autumn Cliffs Way
- 5682 Juno Ct Unit 3
- 5676 Juno Ct Unit 3
- 5669 Juno Ct
- 5664 Autumn Cliffs Way
- 5658 Autumn Cliffs Way
- 5670 Juno Ct Unit 3
- 5693 Malone Ct Unit 3
- 5687 Malone Ct
- 5652 Autumn Cliffs Way