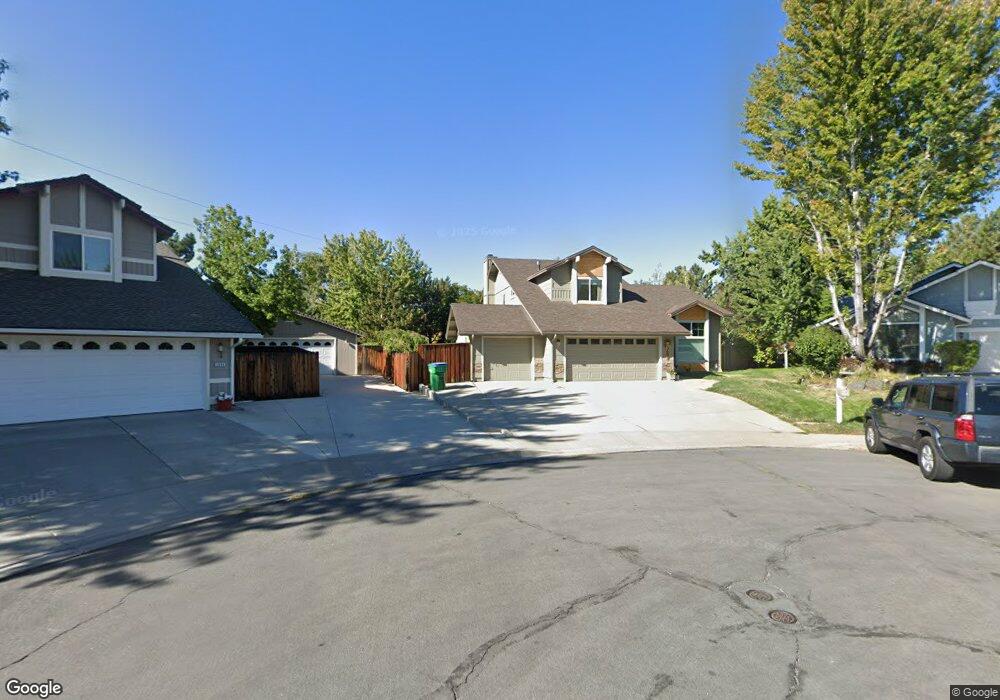
5697 W Rainbow Ridge Ct Reno, NV 89523
Mae Anne Avenue NeighborhoodEstimated Value: $628,000 - $699,840
4
Beds
3
Baths
2,272
Sq Ft
$289/Sq Ft
Est. Value
About This Home
This home is located at 5697 W Rainbow Ridge Ct, Reno, NV 89523 and is currently estimated at $657,710, approximately $289 per square foot. 5697 W Rainbow Ridge Ct is a home located in Washoe County with nearby schools including Sarah Winnemucca Elementary School, B D Billinghurst Middle School, and Robert McQueen High School.
Ownership History
Date
Name
Owned For
Owner Type
Purchase Details
Closed on
Jul 19, 2002
Sold by
Zunini Pamela A
Bought by
Larson Steven M and Larson Paula C
Current Estimated Value
Home Financials for this Owner
Home Financials are based on the most recent Mortgage that was taken out on this home.
Original Mortgage
$197,600
Outstanding Balance
$83,707
Interest Rate
6.7%
Estimated Equity
$574,003
Purchase Details
Closed on
Jan 24, 1997
Sold by
Zunini Michael J
Bought by
Zunini Pamela A
Home Financials for this Owner
Home Financials are based on the most recent Mortgage that was taken out on this home.
Original Mortgage
$161,600
Interest Rate
7.58%
Purchase Details
Closed on
Jan 28, 1994
Sold by
Zunini Pamela Ann
Bought by
Zunini Michael J
Create a Home Valuation Report for This Property
The Home Valuation Report is an in-depth analysis detailing your home's value as well as a comparison with similar homes in the area
Home Values in the Area
Average Home Value in this Area
Purchase History
| Date | Buyer | Sale Price | Title Company |
|---|---|---|---|
| Larson Steven M | $247,000 | Western Title Inc | |
| Zunini Pamela A | $165,000 | Founders Title Co | |
| Zunini Michael J | -- | -- |
Source: Public Records
Mortgage History
| Date | Status | Borrower | Loan Amount |
|---|---|---|---|
| Open | Larson Steven M | $197,600 | |
| Previous Owner | Zunini Pamela A | $161,600 |
Source: Public Records
Tax History Compared to Growth
Tax History
| Year | Tax Paid | Tax Assessment Tax Assessment Total Assessment is a certain percentage of the fair market value that is determined by local assessors to be the total taxable value of land and additions on the property. | Land | Improvement |
|---|---|---|---|---|
| 2025 | $2,880 | $110,010 | $48,664 | $61,346 |
| 2024 | $2,797 | $108,153 | $45,430 | $62,723 |
| 2023 | $2,797 | $108,127 | $48,241 | $59,886 |
| 2022 | $2,717 | $89,981 | $39,732 | $50,249 |
| 2021 | $2,638 | $77,608 | $27,143 | $50,465 |
| 2020 | $2,559 | $79,347 | $28,375 | $50,972 |
| 2019 | $2,424 | $73,668 | $25,949 | $47,719 |
| 2018 | $2,353 | $65,903 | $18,942 | $46,961 |
| 2017 | $2,287 | $65,044 | $17,672 | $47,372 |
| 2016 | $2,230 | $65,968 | $17,248 | $48,720 |
| 2015 | $2,225 | $63,959 | $15,054 | $48,905 |
| 2014 | $2,160 | $59,813 | $12,166 | $47,647 |
| 2013 | -- | $57,057 | $9,972 | $47,085 |
Source: Public Records
Map
Nearby Homes
- 1915 Celestial Ct
- 5721 Royal Vista Way
- 2101 Soldier Pass Ct
- 2130 Canyon Mesa Ct
- 5849 Morgan Horse St
- 1639 Prancer St Unit Lot 47
- 1770 Amarak Way
- 5420 Montego Ct
- 1626 Icelandic Way
- Walker Plan at Monarch
- Humboldt Plan at Monarch
- 1618 Icelandic Way Unit Lot 67
- 1618 Icelandic Way
- 1689 Shadow Park Dr
- 1615 Prancer St Unit Lot 53
- 1627 Prancer St Unit Lot 50
- 1627 Prancer St
- 5921 Sapphire Ridge Ct
- 1931 E Minaret Cir
- 5455 Montego Ct
- 5695 W Rainbow Ridge Ct
- 5690 W Rainbow Ridge Ct
- 5689 W Rainbow Ridge Ct
- 5670 W Rainbow Ridge Ct
- 5671 W Rainbow Ridge Ct
- 5570 Daybreak Dr
- 5580 Daybreak Dr
- 5650 W Rainbow Ridge Ct
- 5651 W Rainbow Ridge Ct
- 5550 Daybreak Dr
- 5560 Daybreak Dr
- 5600 Daybreak Dr
- 5540 Daybreak Dr
- 5590 Daybreak Dr
- 5609 W Rainbow Ridge Ct
- 5610 W Rainbow Ridge Ct
- 5791 Sydney Ct
- 5765 Royal Vista Way
- 5610 Daybreak Dr
- 5805 Sydney Ct