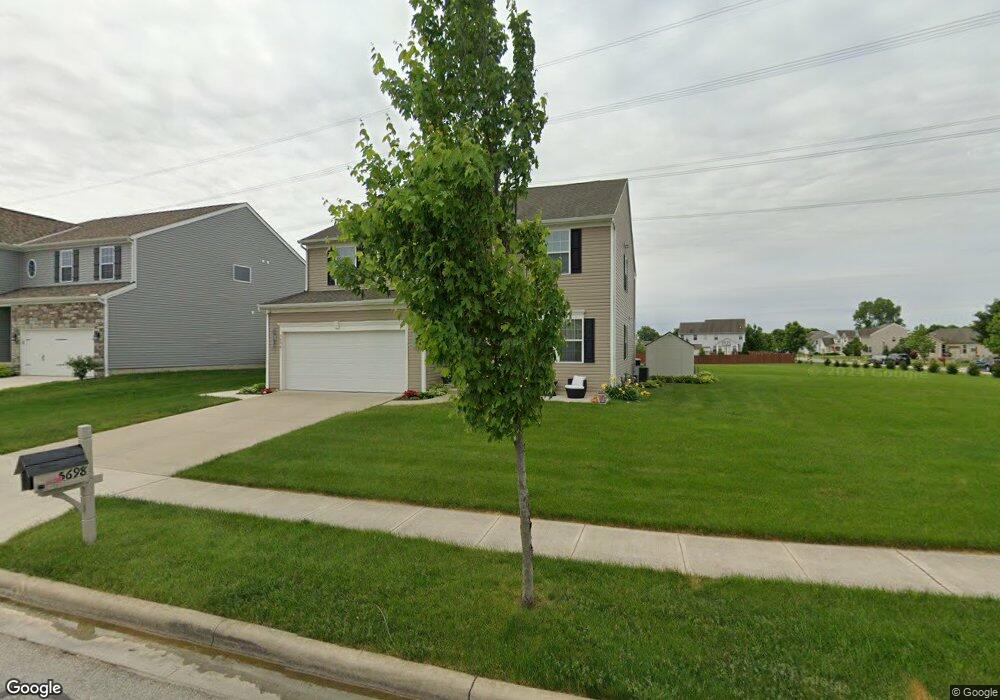
5698 Queen Victoria St Groveport, OH 43125
Estimated Value: $380,000 - $476,000
3
Beds
3
Baths
3,290
Sq Ft
$135/Sq Ft
Est. Value
About This Home
This home is located at 5698 Queen Victoria St, Groveport, OH 43125 and is currently estimated at $445,464, approximately $135 per square foot. 5698 Queen Victoria St is a home with nearby schools including Groveport Madison High School and Groveport Community School.
Ownership History
Date
Name
Owned For
Owner Type
Purchase Details
Closed on
Sep 27, 2017
Sold by
Collins Roger C
Bought by
Collins Roger R and Call Deborah
Current Estimated Value
Purchase Details
Closed on
Oct 27, 2015
Sold by
Wells Fargo Bank Na
Bought by
Collins Roger C
Purchase Details
Closed on
Jun 18, 2015
Sold by
Brown Shirley
Bought by
Wells Fargo Bank Na
Purchase Details
Closed on
Sep 30, 2011
Sold by
Nvr Inc
Bought by
Brown Shirley
Home Financials for this Owner
Home Financials are based on the most recent Mortgage that was taken out on this home.
Original Mortgage
$205,846
Interest Rate
4.25%
Mortgage Type
FHA
Purchase Details
Closed on
Jun 20, 2011
Sold by
Tmg Buckeye Llc
Bought by
Nvr Inc and Ryan Homes
Purchase Details
Closed on
Jun 29, 2010
Sold by
Diyanni Brothers Inc
Bought by
Tmg Buckeye Llc
Home Financials for this Owner
Home Financials are based on the most recent Mortgage that was taken out on this home.
Original Mortgage
$1,717,500
Interest Rate
4.83%
Mortgage Type
Purchase Money Mortgage
Purchase Details
Closed on
Jun 29, 2007
Sold by
Stonehenge Land Co
Bought by
Diyanni Brothers Inc
Create a Home Valuation Report for This Property
The Home Valuation Report is an in-depth analysis detailing your home's value as well as a comparison with similar homes in the area
Home Values in the Area
Average Home Value in this Area
Purchase History
| Date | Buyer | Sale Price | Title Company |
|---|---|---|---|
| Collins Roger R | -- | None Available | |
| Collins Roger C | $135,600 | Attorney | |
| Wells Fargo Bank Na | $135,000 | Attorney | |
| Brown Shirley | $211,300 | Title First | |
| Nvr Inc | $12,800 | Title First | |
| Tmg Buckeye Llc | $196,000 | Title First | |
| Diyanni Brothers Inc | $30,300 | Stewart Tit |
Source: Public Records
Mortgage History
| Date | Status | Borrower | Loan Amount |
|---|---|---|---|
| Previous Owner | Brown Shirley | $205,846 | |
| Previous Owner | Tmg Buckeye Llc | $1,717,500 |
Source: Public Records
Tax History Compared to Growth
Tax History
| Year | Tax Paid | Tax Assessment Tax Assessment Total Assessment is a certain percentage of the fair market value that is determined by local assessors to be the total taxable value of land and additions on the property. | Land | Improvement |
|---|---|---|---|---|
| 2024 | $7,206 | $147,360 | $24,260 | $123,100 |
| 2023 | $7,143 | $147,350 | $24,255 | $123,095 |
| 2022 | $5,770 | $94,960 | $8,400 | $86,560 |
| 2021 | $5,792 | $94,960 | $8,400 | $86,560 |
| 2020 | $5,805 | $94,960 | $8,400 | $86,560 |
| 2019 | $5,449 | $78,580 | $7,000 | $71,580 |
| 2018 | $4,010 | $78,580 | $7,000 | $71,580 |
| 2017 | $4,572 | $78,580 | $7,000 | $71,580 |
| 2016 | $3,653 | $47,470 | $10,680 | $36,790 |
| 2015 | $1,443 | $68,080 | $10,680 | $57,400 |
| 2014 | $4,976 | $68,080 | $10,680 | $57,400 |
| 2013 | $2,232 | $71,645 | $11,235 | $60,410 |
Source: Public Records
Map
Nearby Homes
- 5011 Hickory Grove Cir
- 5652 Red Alder St
- 5156 Sand Ct
- 5151 Bixby Rd
- 4822 Elmont Place
- 5777 Ebright Rd
- 4835 Grove Pointe Dr
- 5548 Harriet St
- 4870 Saw Grove Ct
- 5516 Harriet St
- 5424 Bixby Rd
- 135 Front St
- 111 Church St
- 537 Blacklick St
- 4868 Hendron Rd
- 7474 Groveport Rd
- 287 College St
- 199 Mohr Ave
- 336 Lambert St
- 5680 Winchester Pike
- 5694 Queen Victoria St
- 5699 Queen Victoria St
- 5690 Queen Victoria St
- 5703 Queen Victoria St
- 5695 Queen Victoria St
- 5691 Queen Victoria St
- 5707 Queen Victoria St
- 0 Queen Victoria St
- 5686 Queen Victoria St
- 5711 Queen Victoria St
- 5687 Queen Victoria St
- 5723 Queen Victoria St
- 5682 Queen Victoria St Unit 152
- 5683 Queen Victoria St
- 5678 Queen Victoria St
- 4914 Whispering Falls Dr
- 5679 Queen Victoria St
- 4910 Whispering Falls Dr
- 4910 Whispering Falls Dr Unit EP157
- 4902 Dorchester St