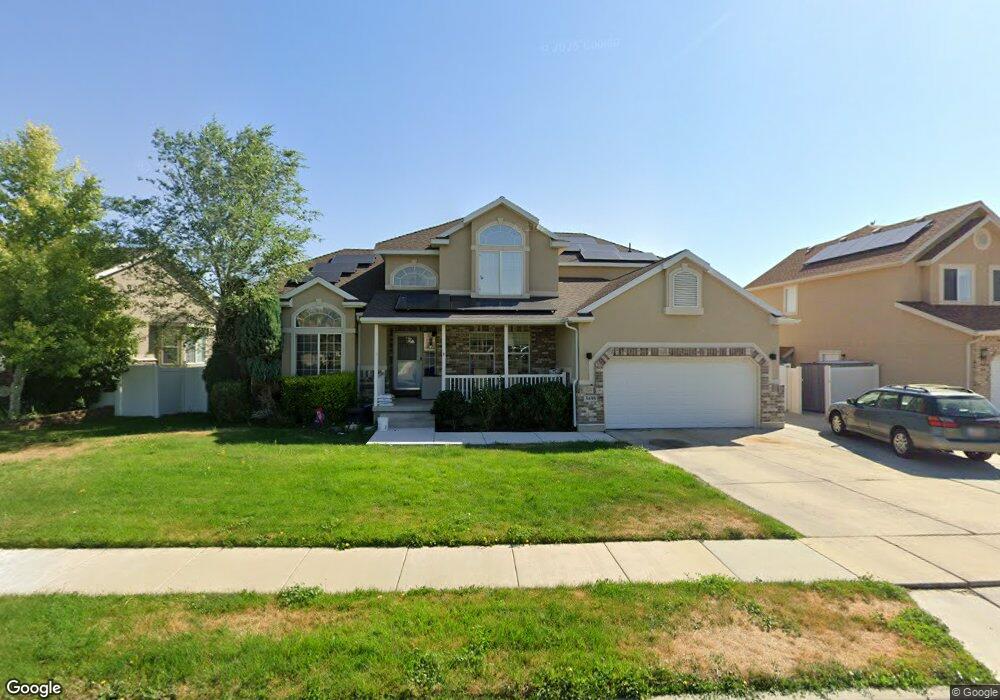
5698 Swift Creek Rd West Jordan, UT 84081
Cobble Creek NeighborhoodEstimated Value: $608,506 - $692,000
4
Beds
3
Baths
2,233
Sq Ft
$294/Sq Ft
Est. Value
About This Home
This home is located at 5698 Swift Creek Rd, West Jordan, UT 84081 and is currently estimated at $655,627, approximately $293 per square foot. 5698 Swift Creek Rd is a home located in Salt Lake County with nearby schools including Hayden Peak Elementary School, West Hills Middle School, and Copper Hills High School.
Ownership History
Date
Name
Owned For
Owner Type
Purchase Details
Closed on
Aug 31, 2006
Sold by
Cutler Scott B and Cutler Annette N
Bought by
Cutler Scott B
Current Estimated Value
Home Financials for this Owner
Home Financials are based on the most recent Mortgage that was taken out on this home.
Original Mortgage
$38,200
Outstanding Balance
$23,053
Interest Rate
6.76%
Mortgage Type
Stand Alone Second
Estimated Equity
$632,574
Purchase Details
Closed on
Mar 15, 2004
Sold by
Ivory Homes Ltd
Bought by
Cutler Scott B and Cutler Annette N
Home Financials for this Owner
Home Financials are based on the most recent Mortgage that was taken out on this home.
Original Mortgage
$208,426
Interest Rate
5.65%
Mortgage Type
Purchase Money Mortgage
Create a Home Valuation Report for This Property
The Home Valuation Report is an in-depth analysis detailing your home's value as well as a comparison with similar homes in the area
Home Values in the Area
Average Home Value in this Area
Purchase History
| Date | Buyer | Sale Price | Title Company |
|---|---|---|---|
| Cutler Scott B | -- | None Available | |
| Cutler Scott B | -- | Cottonwood Title Ins Agency |
Source: Public Records
Mortgage History
| Date | Status | Borrower | Loan Amount |
|---|---|---|---|
| Open | Cutler Scott B | $38,200 | |
| Open | Cutler Scott B | $305,600 | |
| Closed | Cutler Scott B | $208,426 | |
| Closed | Cutler Scott B | $39,080 |
Source: Public Records
Tax History Compared to Growth
Tax History
| Year | Tax Paid | Tax Assessment Tax Assessment Total Assessment is a certain percentage of the fair market value that is determined by local assessors to be the total taxable value of land and additions on the property. | Land | Improvement |
|---|---|---|---|---|
| 2025 | $3,003 | $594,900 | $164,100 | $430,800 |
| 2024 | $3,003 | $577,800 | $159,300 | $418,500 |
| 2023 | $3,003 | $552,800 | $153,200 | $399,600 |
| 2022 | $3,159 | $563,500 | $150,200 | $413,300 |
| 2021 | $2,647 | $429,800 | $118,300 | $311,500 |
| 2020 | $2,489 | $379,400 | $118,300 | $261,100 |
| 2019 | $2,514 | $375,700 | $118,300 | $257,400 |
| 2018 | $2,376 | $352,200 | $116,400 | $235,800 |
| 2017 | $2,244 | $331,200 | $116,400 | $214,800 |
| 2016 | $2,208 | $306,200 | $113,600 | $192,600 |
| 2015 | $2,258 | $305,300 | $115,700 | $189,600 |
| 2014 | $2,051 | $273,000 | $104,900 | $168,100 |
Source: Public Records
Map
Nearby Homes
- 5946 W Eric Mountain Ln Unit 103
- 5958 W Eric Mountain Ln
- 5958 W Eric Mountain Ln Unit 104
- 8501 S Michele River Ave Unit 116
- Larsen Plan at Copperhaven by Toll Brothers
- Brooke Plan at Copperhaven by Toll Brothers
- 8453 S Windmill Dr
- 5958 W 8100 S
- 5422 W Island Creek Dr
- 5527 W Caliente Dr
- 5582 Washoe Cove
- 6006 W Highlandbrook Dr
- 8793 S Big Bar Ct
- 5298 W Icehouse Way
- 8368 S Oak Gate Dr
- 8854 Rocky Creek Dr
- 6036 W Sapphire St Unit 344
- 5183 W Swift Water Way
- 6042 W Sapphire St Unit 343
- 6046 W Sapphire St Unit 342
- 5706 W Swift Creek Rd
- 5706 Swift Creek Rd
- 5688 Swift Creek Rd
- 5689 Mirror Lake Dr
- 5689 W Mirror Lake Dr
- 5679 W Mirror Lake Dr
- 5679 Mirror Lake Dr
- 5682 W Swift Creek Rd
- 5682 Swift Creek Rd
- 5714 W Swift Creek Rd
- 5714 Swift Creek Rd
- 5693 Mirror Lake Dr
- 8414 Town View Cir
- 8413 Town View Cir
- 5667 Mirror Lake Dr
- 5667 W Mirror Lake Dr
- 5717 Swift Creek Rd
- 8404 Shallow Creek Rd
- 8404 S Shallow Creek Rd
- 5672 Swift Creek Rd