57-101 W Kuilima Loop Unit 21 Kahuku, HI 96731
Estimated Value: $1,060,000 - $1,204,774
1
Bed
1
Bath
658
Sq Ft
$1,729/Sq Ft
Est. Value
About This Home
This home is located at 57-101 W Kuilima Loop Unit 21, Kahuku, HI 96731 and is currently estimated at $1,137,694, approximately $1,729 per square foot. 57-101 W Kuilima Loop Unit 21 is a home located in Honolulu County with nearby schools including Kahuku Elementary School and Kahuku High & Intermediate School.
Ownership History
Date
Name
Owned For
Owner Type
Purchase Details
Closed on
Mar 23, 2022
Sold by
Henry Murphy Victor and Lynn Jennifer
Bought by
Chaloeicheep Charles Quinn and Lau-Chaloeicheep Joan
Current Estimated Value
Home Financials for this Owner
Home Financials are based on the most recent Mortgage that was taken out on this home.
Original Mortgage
$490,000
Outstanding Balance
$457,818
Interest Rate
3.92%
Mortgage Type
New Conventional
Estimated Equity
$679,876
Purchase Details
Closed on
May 31, 2015
Sold by
Sundby Scott Ray and Sundby Sarah Daphne
Bought by
The Jewett Family Trust
Purchase Details
Closed on
Apr 29, 2011
Sold by
Association Of Apartment Owners Of Kuili
Bought by
Sundby Scott Ray and Sundby Sarah Daphne
Create a Home Valuation Report for This Property
The Home Valuation Report is an in-depth analysis detailing your home's value as well as a comparison with similar homes in the area
Home Values in the Area
Average Home Value in this Area
Purchase History
| Date | Buyer | Sale Price | Title Company |
|---|---|---|---|
| Chaloeicheep Charles Quinn | $875,000 | First American Mortgage Soluti | |
| Chaloeicheep Charles Quinn | $875,000 | First American Mortgage Soluti | |
| The Jewett Family Trust | $425,000 | Fam | |
| The Jewett Family Trust | $425,000 | Fam | |
| Sundby Scott Ray | $37,729 | Tg |
Source: Public Records
Mortgage History
| Date | Status | Borrower | Loan Amount |
|---|---|---|---|
| Open | Chaloeicheep Charles Quinn | $490,000 | |
| Closed | Chaloeicheep Charles Quinn | $490,000 |
Source: Public Records
Tax History Compared to Growth
Tax History
| Year | Tax Paid | Tax Assessment Tax Assessment Total Assessment is a certain percentage of the fair market value that is determined by local assessors to be the total taxable value of land and additions on the property. | Land | Improvement |
|---|---|---|---|---|
| 2025 | $9,578 | $1,153,900 | $203,000 | $950,900 |
| 2024 | $9,578 | $1,006,800 | $188,000 | $818,800 |
| 2023 | $4,765 | $1,067,100 | $188,000 | $879,100 |
| 2022 | $2,162 | $617,700 | $170,900 | $446,800 |
| 2021 | $1,879 | $536,800 | $138,900 | $397,900 |
| 2020 | $1,996 | $570,300 | $128,200 | $442,100 |
| 2019 | $1,861 | $557,100 | $149,600 | $407,500 |
| 2018 | $1,861 | $531,600 | $143,900 | $387,700 |
| 2017 | $1,390 | $397,000 | $135,300 | $261,700 |
| 2016 | $1,213 | $346,700 | $132,500 | $214,200 |
| 2015 | $1,161 | $331,800 | $126,900 | $204,900 |
| 2014 | $1,025 | $275,200 | $118,400 | $156,800 |
Source: Public Records
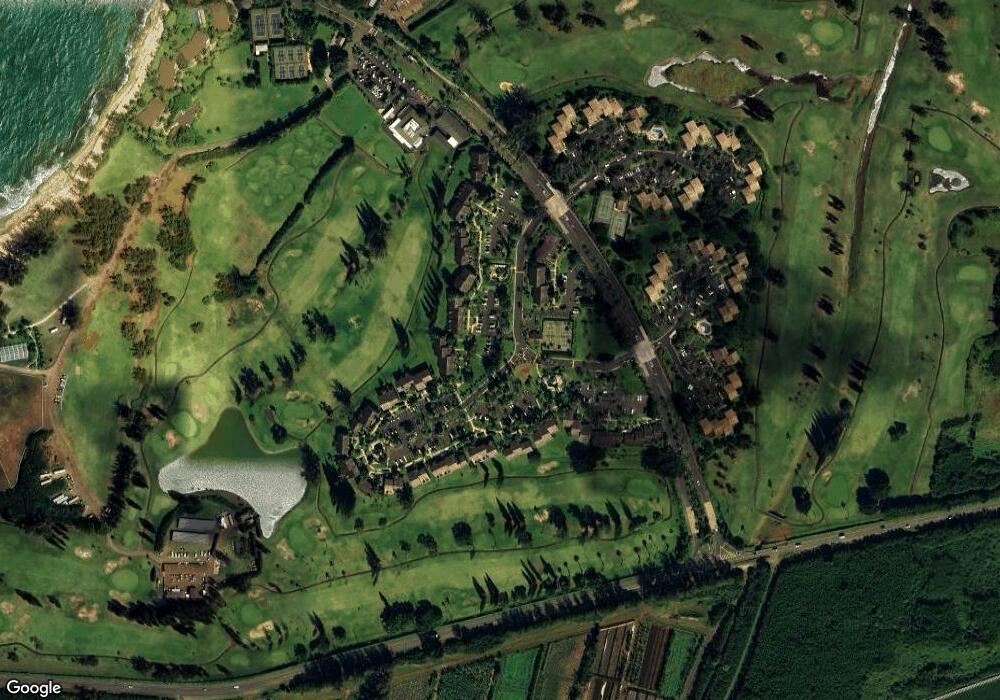
Map
Nearby Homes
- 57-101 Kuilima Dr Unit 1
- 57-101 Kuilima Dr Unit 189
- 57-101 Kuilima Dr Unit 132F
- 57-101 Kuilima Dr Unit 191A
- 57-101 Kuilima Dr Unit 35
- 57-101 Kuilima Dr Unit 177A
- 56-1060 Kamehameha Hwy
- 56-1080 Kamehameha Hwy Unit 2
- 58-150 Napoonala Place
- 58-153 Napoonala Place
- 58-358 Kamehameha Hwy Unit A
- 58-248 Kamehameha Hwy Unit C1
- 58-15 Maika Place
- 58-1 Makanale St
- 56-377 Leleuli St
- 59-75 Hoalua St
- 56-1081 Kamehameha Hwy
- 56-481 Kamehameha Hwy Unit HM351
- 56-419 Kamehameha Hwy Unit NC45
- 56-419 Kamehameha Hwy Unit NC43
- 57-101 W Kuilima Loop Unit 14
- 57-101 W Kuilima Loop Unit 21
- 57-101 W Kuilima Loop Unit 18
- 57-101 W Kuilima Loop Unit 19
- 57-101 W Kuilima Loop Unit 23
- 57-101 W Kuilima Loop Unit 19
- 57-101 W Kuilima Loop Unit 21
- 57-101 W Kuilima Loop Unit 19
- 57-101 W Kuilima Loop Unit 18
- 57-101 W Kuilima Loop Unit 22
- 57-101 W Kuilima Loop Unit 14
- 57-101 W Kuilima Loop Unit 15
- 57-101 W Kuilima Loop Unit 19
- 57-101 W Kuilima Loop Unit 19
- 57-101 W Kuilima Loop Unit 16
- 57-101 W Kuilima Loop Unit 21
- 57-101 W Kuilima Loop Unit 22
- 57-101 W Kuilima Loop Unit 16
- 57-101 W Kuilima Loop Unit 23
- 57-101 W Kuilima Loop Unit 22