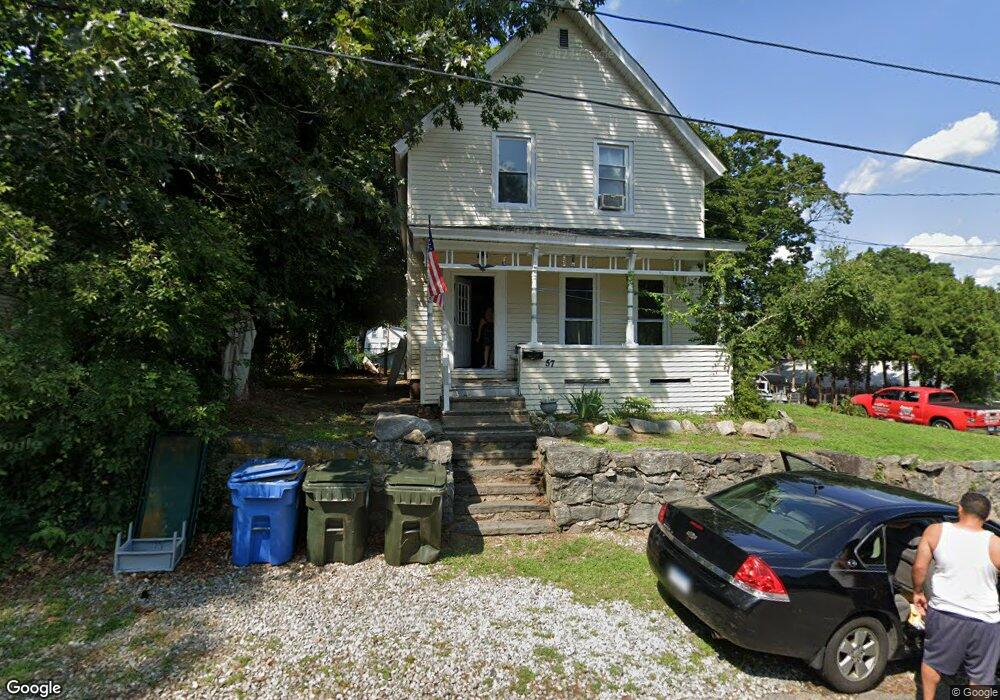
57 11th St Norwich, CT 06360
Central Norwich NeighborhoodEstimated Value: $229,000 - $306,000
4
Beds
2
Baths
1,674
Sq Ft
$155/Sq Ft
Est. Value
About This Home
This home is located at 57 11th St, Norwich, CT 06360 and is currently estimated at $259,757, approximately $155 per square foot. 57 11th St is a home located in New London County with nearby schools including Moriarty Magnet Elementary School, Kelly STEAM Magnet Middle School, and Integrated Day Charter School.
Ownership History
Date
Name
Owned For
Owner Type
Purchase Details
Closed on
Jul 30, 2024
Sold by
Gay James M
Bought by
57 Yellowhouse Llc
Current Estimated Value
Purchase Details
Closed on
Apr 22, 2010
Sold by
Bank Of New York Mello
Bought by
Bozrah Prop Llc
Purchase Details
Closed on
Oct 7, 2009
Sold by
Harris Nicole
Bought by
Bank Of New York
Purchase Details
Closed on
Mar 4, 1994
Sold by
Prudential Hm Mtg Co
Bought by
Gay James
Home Financials for this Owner
Home Financials are based on the most recent Mortgage that was taken out on this home.
Original Mortgage
$47,700
Interest Rate
7.01%
Mortgage Type
Unknown
Purchase Details
Closed on
Jun 23, 1989
Sold by
Nelson David
Bought by
Baird Eileen
Create a Home Valuation Report for This Property
The Home Valuation Report is an in-depth analysis detailing your home's value as well as a comparison with similar homes in the area
Home Values in the Area
Average Home Value in this Area
Purchase History
| Date | Buyer | Sale Price | Title Company |
|---|---|---|---|
| 57 Yellowhouse Llc | -- | None Available | |
| 57 Yellowhouse Llc | -- | None Available | |
| 57 Yellowhouse Llc | -- | None Available | |
| Bozrah Prop Llc | $40,000 | -- | |
| Bank Of New York | -- | -- | |
| Gay James | $53,000 | -- | |
| Bozrah Prop Llc | $40,000 | -- | |
| Bank Of New York | -- | -- | |
| Gay James | $53,000 | -- | |
| Baird Eileen | $138,000 | -- |
Source: Public Records
Mortgage History
| Date | Status | Borrower | Loan Amount |
|---|---|---|---|
| Previous Owner | Baird Eileen | $90,000 | |
| Previous Owner | Baird Eileen | $47,700 |
Source: Public Records
Tax History Compared to Growth
Tax History
| Year | Tax Paid | Tax Assessment Tax Assessment Total Assessment is a certain percentage of the fair market value that is determined by local assessors to be the total taxable value of land and additions on the property. | Land | Improvement |
|---|---|---|---|---|
| 2025 | $6,317 | $156,100 | $39,400 | $116,700 |
| 2024 | $5,963 | $156,100 | $39,400 | $116,700 |
| 2023 | $4,596 | $94,500 | $22,700 | $71,800 |
| 2022 | $4,581 | $94,500 | $22,700 | $71,800 |
| 2021 | $4,596 | $94,500 | $22,700 | $71,800 |
| 2020 | $4,580 | $94,500 | $22,700 | $71,800 |
| 2019 | $4,535 | $94,500 | $22,700 | $71,800 |
| 2018 | $3,944 | $81,500 | $18,400 | $63,100 |
| 2017 | $3,972 | $81,500 | $18,400 | $63,100 |
| 2016 | $3,998 | $81,500 | $18,400 | $63,100 |
| 2015 | $3,917 | $81,500 | $18,400 | $63,100 |
| 2014 | $3,743 | $81,500 | $18,400 | $63,100 |
Source: Public Records
Map
Nearby Homes
- 313 Central Ave
- 435 Boswell Ave
- 625 N Main St Unit 627
- 556 Boswell Ave
- 287 Central Ave
- 607A Boswell Ave
- 6 Alexander St
- 367 Boswell Ave
- 113 4th St
- 90 4th St
- 79 Roosevelt Ave
- 197 Central Ave
- 188 Central Ave
- 17 Sylvester St
- 180 Central Ave
- 276 Boswell Ave
- 272 Boswell Ave
- 108 Central Ave
- 296 Hamilton Ave Unit 7
- 296 Hamilton Ave Unit 30