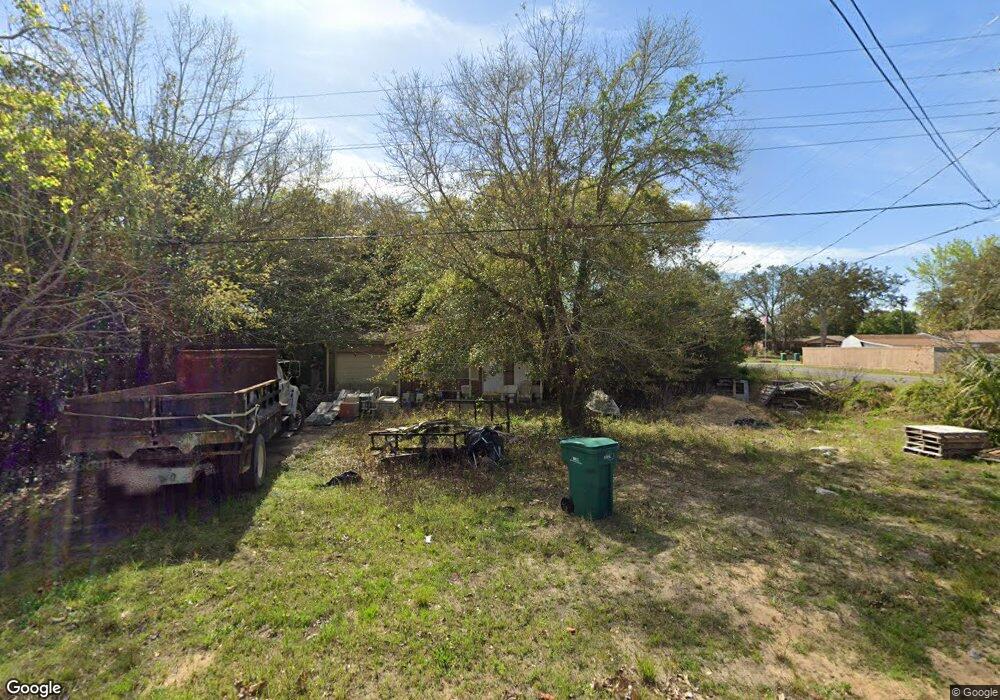
57 11th St Shalimar, FL 32579
Estimated Value: $216,000 - $222,155
3
Beds
2
Baths
900
Sq Ft
$244/Sq Ft
Est. Value
About This Home
This home is located at 57 11th St, Shalimar, FL 32579 and is currently estimated at $219,789, approximately $244 per square foot. 57 11th St is a home located in Okaloosa County with nearby schools including Shalimar Elementary School, Clifford Meigs Middle School, and Choctawhatchee Senior High School.
Ownership History
Date
Name
Owned For
Owner Type
Purchase Details
Closed on
Feb 17, 2015
Sold by
Thibou Cherylle A
Bought by
Shalimar Living Llc
Current Estimated Value
Purchase Details
Closed on
Jan 26, 2001
Sold by
Hatcher Glenn and Hatcher Patricia A
Bought by
Thibou Cherylle and Latimer Cherylle
Home Financials for this Owner
Home Financials are based on the most recent Mortgage that was taken out on this home.
Original Mortgage
$51,750
Interest Rate
7.18%
Create a Home Valuation Report for This Property
The Home Valuation Report is an in-depth analysis detailing your home's value as well as a comparison with similar homes in the area
Home Values in the Area
Average Home Value in this Area
Purchase History
| Date | Buyer | Sale Price | Title Company |
|---|---|---|---|
| Shalimar Living Llc | $44,500 | None Available | |
| Thibou Cherylle | -- | -- |
Source: Public Records
Mortgage History
| Date | Status | Borrower | Loan Amount |
|---|---|---|---|
| Previous Owner | Thibou Cherylle | $51,750 |
Source: Public Records
Tax History
| Year | Tax Paid | Tax Assessment Tax Assessment Total Assessment is a certain percentage of the fair market value that is determined by local assessors to be the total taxable value of land and additions on the property. | Land | Improvement |
|---|---|---|---|---|
| 2025 | $1,843 | $150,617 | $83,200 | $67,417 |
| 2024 | $1,727 | $150,908 | $64,024 | $86,884 |
| 2023 | $1,727 | $145,737 | $58,203 | $87,534 |
| 2022 | $1,596 | $134,676 | $54,396 | $80,280 |
| 2021 | $1,428 | $111,139 | $48,567 | $62,572 |
| 2020 | $1,354 | $104,598 | $47,610 | $56,988 |
| 2019 | $1,257 | $95,823 | $45,343 | $50,480 |
| 2018 | $1,223 | $92,119 | $0 | $0 |
| 2017 | $1,199 | $89,926 | $0 | $0 |
| 2016 | $1,153 | $86,992 | $0 | $0 |
| 2015 | $1,126 | $83,742 | $0 | $0 |
| 2014 | $1,098 | $81,593 | $0 | $0 |
Source: Public Records
Map
Nearby Homes
Your Personal Tour Guide
Ask me questions while you tour the home.