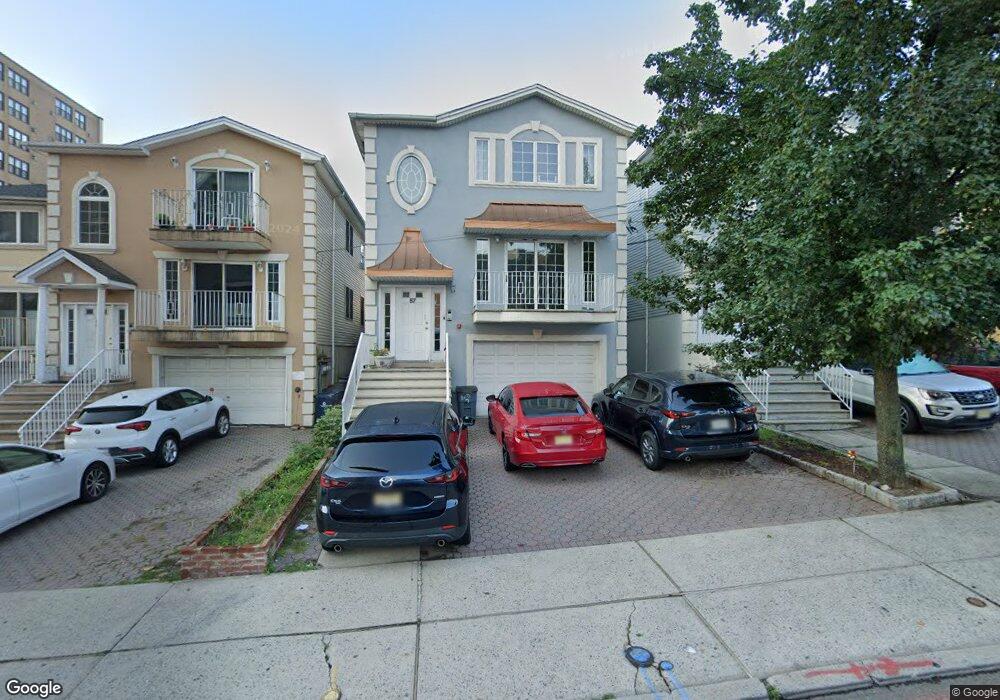
57 71st St Unit 3 Guttenberg, NJ 07093
Estimated Value: $923,000 - $1,120,000
3
Beds
2
Baths
2,880
Sq Ft
$356/Sq Ft
Est. Value
About This Home
This home is located at 57 71st St Unit 3, Guttenberg, NJ 07093 and is currently estimated at $1,024,273, approximately $355 per square foot. 57 71st St Unit 3 is a home located in Hudson County with nearby schools including Anna L. Klein Elementary School and St. Joseph of the Palisades Elementary School.
Ownership History
Date
Name
Owned For
Owner Type
Purchase Details
Closed on
Oct 2, 2019
Sold by
Ansari Kamran
Bought by
Connor Kaylin Llc
Current Estimated Value
Purchase Details
Closed on
Jun 21, 2019
Sold by
Rashid Wisam and Rashid Mohammed
Bought by
Ansari Kamran
Purchase Details
Closed on
Aug 4, 1998
Sold by
Rashid Mohammed A
Bought by
Rashid Wisam
Purchase Details
Closed on
Aug 29, 1997
Sold by
Hashash Nasser D and Hashash Hannah Rashid
Bought by
Rashid Mohammed A and Rashid Wisam
Home Financials for this Owner
Home Financials are based on the most recent Mortgage that was taken out on this home.
Original Mortgage
$263,000
Interest Rate
7.52%
Purchase Details
Closed on
Aug 21, 1996
Sold by
Riverwalk Homes Inc
Bought by
Rashid Mohammed A and Rashid Wisam
Home Financials for this Owner
Home Financials are based on the most recent Mortgage that was taken out on this home.
Original Mortgage
$270,000
Interest Rate
8.18%
Create a Home Valuation Report for This Property
The Home Valuation Report is an in-depth analysis detailing your home's value as well as a comparison with similar homes in the area
Home Values in the Area
Average Home Value in this Area
Purchase History
| Date | Buyer | Sale Price | Title Company |
|---|---|---|---|
| Connor Kaylin Llc | -- | Chicago Title Insurance Co | |
| Ansari Kamran | $700,000 | All Ahead Title Agency | |
| Rashid Wisam | -- | -- | |
| Rashid Mohammed A | $30,000 | -- | |
| Rashid Mohammed A | $360,000 | -- |
Source: Public Records
Mortgage History
| Date | Status | Borrower | Loan Amount |
|---|---|---|---|
| Previous Owner | Rashid Mohammed A | $263,000 | |
| Previous Owner | Rashid Mohammed A | $270,000 |
Source: Public Records
Tax History Compared to Growth
Tax History
| Year | Tax Paid | Tax Assessment Tax Assessment Total Assessment is a certain percentage of the fair market value that is determined by local assessors to be the total taxable value of land and additions on the property. | Land | Improvement |
|---|---|---|---|---|
| 2025 | $23,084 | $559,200 | $120,000 | $439,200 |
| 2024 | $22,334 | $559,200 | $120,000 | $439,200 |
| 2023 | $22,334 | $559,200 | $120,000 | $439,200 |
| 2022 | $21,680 | $559,200 | $120,000 | $439,200 |
| 2021 | $21,708 | $559,200 | $120,000 | $439,200 |
| 2020 | $21,591 | $559,200 | $120,000 | $439,200 |
| 2019 | $21,417 | $559,200 | $120,000 | $439,200 |
| 2018 | $20,841 | $559,200 | $120,000 | $439,200 |
| 2017 | $20,551 | $559,200 | $120,000 | $439,200 |
| 2016 | $20,411 | $559,200 | $120,000 | $439,200 |
| 2015 | $20,243 | $559,200 | $120,000 | $439,200 |
| 2014 | $19,796 | $559,200 | $120,000 | $439,200 |
Source: Public Records
Map
Nearby Homes
- 55 71st St
- 7100 Jfk Blvd E Unit 5E
- 7100 Jfk Blvd E Unit 2N
- 7100 Boulevard E Unit 14 M
- 7100 Blvd E Unit 10P
- 7100 Blvd E Unit 2N
- 7100 Blvd E Unit 5E
- 7100 Blvd E Unit 14 D
- 62 69th St Unit 503
- 61 69th St Unit C3
- 7004 Boulevard E Unit 6a
- 7004 Boulevard E Unit 11B
- 7004 Boulevard E Unit 27A
- 7004 Boulevard E Unit 44B
- 56 68th St Unit 8
- 56 68th St Unit . 8
- 56 68th St Unit 5
- 7002 Jfk Blvd E Unit 32F
- 7002 Jfk Blvd E Unit 25E
- 7002 Jfk Blvd E Unit 22A
- 57 71st St
- 55 71st St Unit 2
- 55 71st St Unit 1
- 59 71st St
- 59 71st St Unit GR
- 59 71st St Unit 1
- 59 71st St Unit 3
- 59 71st St Unit 2
- 61 71st St
- 61 71st St Unit 1
- 61 71st St Unit 2
- 53 71st St
- 63 71st St
- 63 71st St Unit 2
- 58 70th St
- 58 70th St Unit 1
- 52 70th St Unit 54
- 65 71st St
- 65 71st St Unit 1
- 65 71st St Unit 2