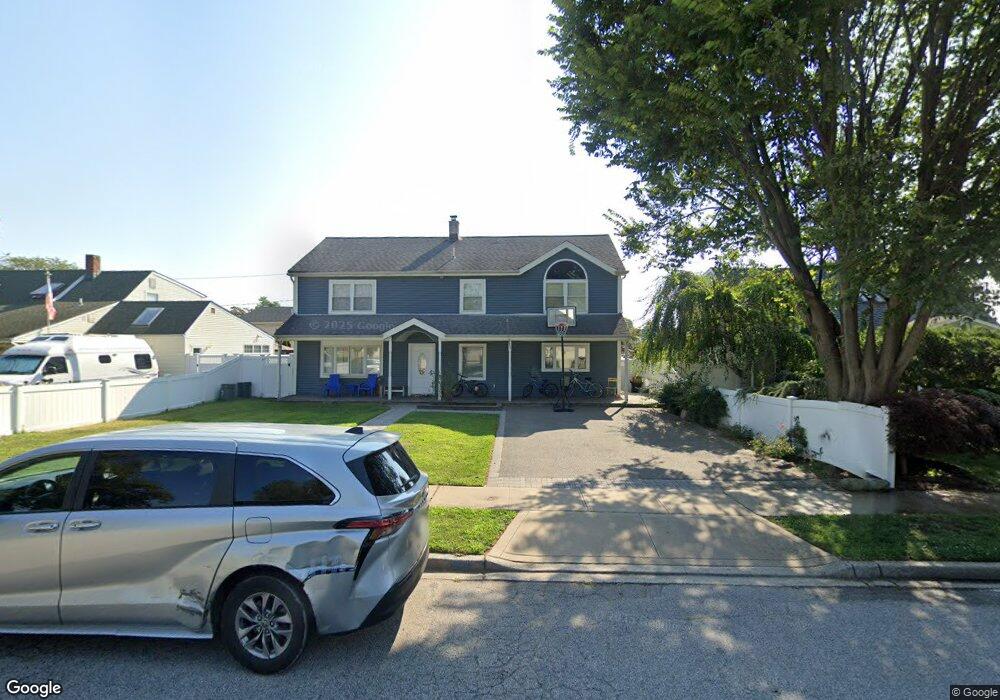
57 Acorn Ln Levittown, NY 11756
Estimated Value: $828,000 - $909,514
--
Bed
1
Bath
1,125
Sq Ft
$772/Sq Ft
Est. Value
About This Home
This home is located at 57 Acorn Ln, Levittown, NY 11756 and is currently estimated at $868,757, approximately $772 per square foot. 57 Acorn Ln is a home located in Nassau County with nearby schools including Abbey Lane Elementary School, Wisdom Lane Middle School, and Division Avenue Senior High School.
Ownership History
Date
Name
Owned For
Owner Type
Purchase Details
Closed on
Jul 15, 2021
Sold by
Oringer David and Oringer Denise
Bought by
Xu Shi Sheng and Jiang Sai Dan
Current Estimated Value
Home Financials for this Owner
Home Financials are based on the most recent Mortgage that was taken out on this home.
Original Mortgage
$468,000
Outstanding Balance
$432,798
Interest Rate
4.25%
Mortgage Type
New Conventional
Estimated Equity
$435,959
Purchase Details
Closed on
Apr 30, 1998
Purchase Details
Closed on
Nov 7, 1997
Create a Home Valuation Report for This Property
The Home Valuation Report is an in-depth analysis detailing your home's value as well as a comparison with similar homes in the area
Home Values in the Area
Average Home Value in this Area
Purchase History
| Date | Buyer | Sale Price | Title Company |
|---|---|---|---|
| Xu Shi Sheng | $720,000 | Security Title | |
| -- | $130,000 | -- | |
| -- | $129,500 | -- |
Source: Public Records
Mortgage History
| Date | Status | Borrower | Loan Amount |
|---|---|---|---|
| Open | Xu Shi Sheng | $468,000 |
Source: Public Records
Tax History Compared to Growth
Tax History
| Year | Tax Paid | Tax Assessment Tax Assessment Total Assessment is a certain percentage of the fair market value that is determined by local assessors to be the total taxable value of land and additions on the property. | Land | Improvement |
|---|---|---|---|---|
| 2025 | $12,947 | $381 | $215 | $166 |
| 2024 | $3,679 | $391 | $221 | $170 |
| 2023 | $12,994 | $391 | $221 | $170 |
| 2022 | $12,994 | $391 | $221 | $170 |
| 2021 | $15,953 | $372 | $210 | $162 |
| 2020 | $11,921 | $628 | $552 | $76 |
| 2019 | $3,897 | $628 | $552 | $76 |
| 2018 | $3,830 | $628 | $0 | $0 |
| 2017 | $6,647 | $628 | $552 | $76 |
| 2016 | $10,227 | $628 | $552 | $76 |
| 2015 | $3,138 | $628 | $552 | $76 |
| 2014 | $3,138 | $628 | $552 | $76 |
| 2013 | $2,944 | $628 | $552 | $76 |
Source: Public Records
Map
Nearby Homes