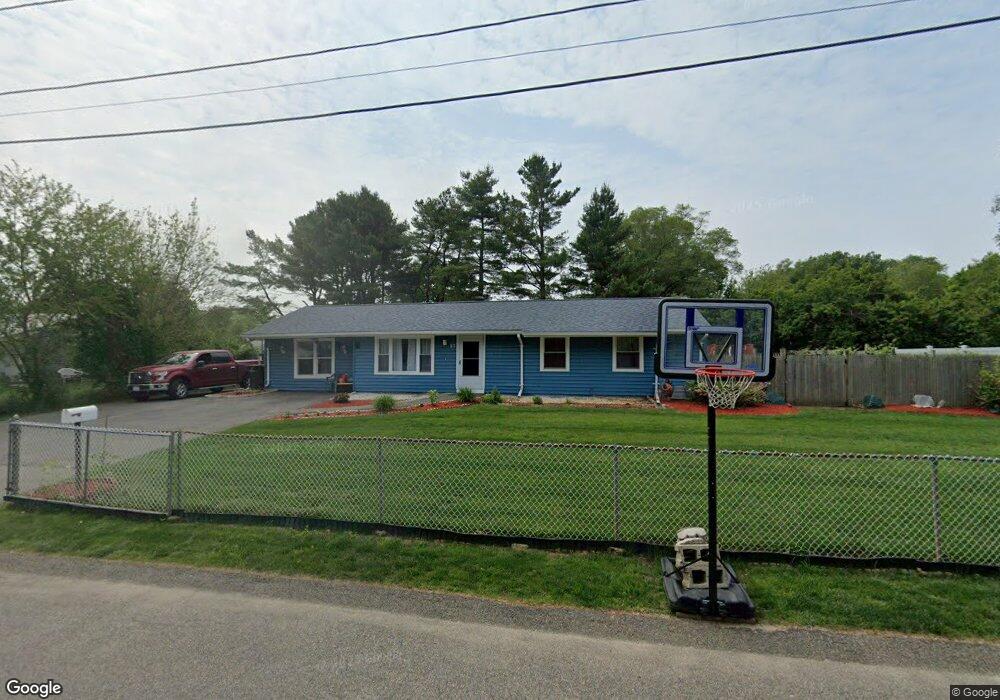
57 Backlund Dr Brockton, MA 02302
Estimated Value: $465,000 - $489,001
3
Beds
1
Bath
1,232
Sq Ft
$390/Sq Ft
Est. Value
About This Home
This home is located at 57 Backlund Dr, Brockton, MA 02302 and is currently estimated at $480,250, approximately $389 per square foot. 57 Backlund Dr is a home located in Plymouth County with nearby schools including Davis K-8 School, John F. Kennedy Elementary School, and South Middle School.
Ownership History
Date
Name
Owned For
Owner Type
Purchase Details
Closed on
May 10, 2024
Sold by
Kornegay George B
Bought by
Kornegay George B and Kornegay Deborah L
Current Estimated Value
Purchase Details
Closed on
Dec 18, 1998
Sold by
Sheehy Michael J and Sheehy] Margaret P
Bought by
Kornegay George B
Home Financials for this Owner
Home Financials are based on the most recent Mortgage that was taken out on this home.
Original Mortgage
$105,317
Interest Rate
6.85%
Mortgage Type
Purchase Money Mortgage
Create a Home Valuation Report for This Property
The Home Valuation Report is an in-depth analysis detailing your home's value as well as a comparison with similar homes in the area
Home Values in the Area
Average Home Value in this Area
Purchase History
| Date | Buyer | Sale Price | Title Company |
|---|---|---|---|
| Kornegay George B | -- | None Available | |
| Kornegay George B | -- | None Available | |
| Kornegay George B | $106,000 | -- | |
| Kornegay George B | $106,000 | -- |
Source: Public Records
Mortgage History
| Date | Status | Borrower | Loan Amount |
|---|---|---|---|
| Previous Owner | Kornegay George B | $167,700 | |
| Previous Owner | Kornegay George B | $145,500 | |
| Previous Owner | Kornegay George B | $105,317 |
Source: Public Records
Tax History Compared to Growth
Tax History
| Year | Tax Paid | Tax Assessment Tax Assessment Total Assessment is a certain percentage of the fair market value that is determined by local assessors to be the total taxable value of land and additions on the property. | Land | Improvement |
|---|---|---|---|---|
| 2025 | $4,769 | $393,800 | $162,400 | $231,400 |
| 2024 | $4,559 | $379,300 | $162,400 | $216,900 |
| 2023 | $4,394 | $338,500 | $112,800 | $225,700 |
| 2022 | $4,061 | $290,700 | $102,500 | $188,200 |
| 2021 | $4,056 | $279,700 | $95,900 | $183,800 |
| 2020 | $3,968 | $261,900 | $83,800 | $178,100 |
| 2019 | $3,663 | $235,700 | $80,300 | $155,400 |
| 2018 | $3,446 | $214,600 | $80,300 | $134,300 |
| 2017 | $2,908 | $180,600 | $80,300 | $100,300 |
| 2016 | $3,130 | $180,300 | $76,600 | $103,700 |
| 2015 | $2,795 | $154,000 | $76,600 | $77,400 |
| 2014 | $2,910 | $160,500 | $76,600 | $83,900 |
Source: Public Records
Map
Nearby Homes