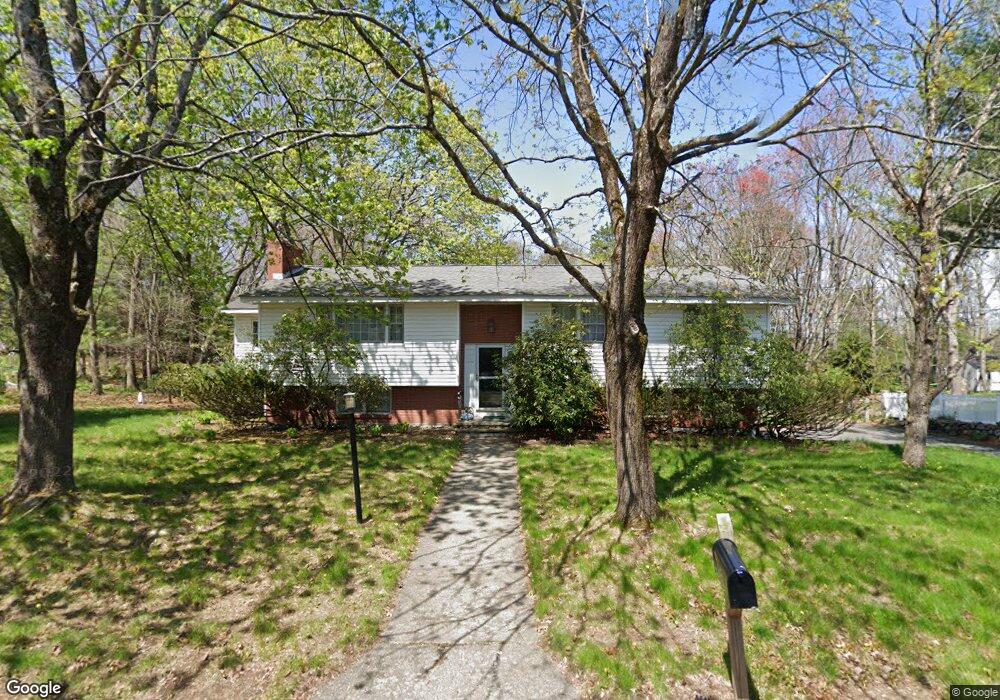
57 Bayberry Rd Concord, MA 01742
Estimated Value: $960,660 - $1,046,000
3
Beds
3
Baths
1,810
Sq Ft
$561/Sq Ft
Est. Value
About This Home
This home is located at 57 Bayberry Rd, Concord, MA 01742 and is currently estimated at $1,015,165, approximately $560 per square foot. 57 Bayberry Rd is a home located in Middlesex County with nearby schools including Thoreau Elementary School, Concord Middle School, and Concord Carlisle High School.
Ownership History
Date
Name
Owned For
Owner Type
Purchase Details
Closed on
Dec 22, 2020
Sold by
Raddassi Khadir and Raddassi Isabelle
Bought by
Raddassi Khadir and Guillemain Isabelle
Current Estimated Value
Purchase Details
Closed on
Nov 25, 2003
Sold by
Oriel Elizabeth C and Oriel Sandra K
Bought by
Raddassi Khadir and Raddassi Isabelle
Home Financials for this Owner
Home Financials are based on the most recent Mortgage that was taken out on this home.
Original Mortgage
$376,000
Interest Rate
5.98%
Mortgage Type
Purchase Money Mortgage
Purchase Details
Closed on
Sep 28, 1999
Sold by
Carter Harry T and Carter Joyce K
Bought by
Oriel Elizabeth C and Oriel Sandra K
Purchase Details
Closed on
Apr 2, 1997
Sold by
57 Bayberry Ft and Dagostino Anthony
Bought by
Carter Harry T and Carter Joyce K
Purchase Details
Closed on
Mar 23, 1994
Sold by
Dagostino Rose
Bought by
57 Bayberry Ft and Dagostino Anthony
Create a Home Valuation Report for This Property
The Home Valuation Report is an in-depth analysis detailing your home's value as well as a comparison with similar homes in the area
Home Values in the Area
Average Home Value in this Area
Purchase History
| Date | Buyer | Sale Price | Title Company |
|---|---|---|---|
| Raddassi Khadir | -- | None Available | |
| Raddassi Khadir | $470,000 | -- | |
| Oriel Elizabeth C | $350,280 | -- | |
| Carter Harry T | $280,000 | -- | |
| 57 Bayberry Ft | $160,000 | -- |
Source: Public Records
Mortgage History
| Date | Status | Borrower | Loan Amount |
|---|---|---|---|
| Previous Owner | 57 Bayberry Ft | $350,000 | |
| Previous Owner | 57 Bayberry Ft | $353,000 | |
| Previous Owner | Raddassi Khadir | $376,000 |
Source: Public Records
Tax History
| Year | Tax Paid | Tax Assessment Tax Assessment Total Assessment is a certain percentage of the fair market value that is determined by local assessors to be the total taxable value of land and additions on the property. | Land | Improvement |
|---|---|---|---|---|
| 2025 | $117 | $882,100 | $523,300 | $358,800 |
| 2024 | $11,196 | $852,700 | $523,300 | $329,400 |
| 2023 | $10,435 | $805,200 | $475,800 | $329,400 |
| 2022 | $9,610 | $651,100 | $380,500 | $270,600 |
| 2021 | $9,514 | $646,300 | $380,500 | $265,800 |
| 2020 | $9,046 | $635,700 | $380,500 | $255,200 |
| 2019 | $9,317 | $656,600 | $393,100 | $263,500 |
| 2018 | $8,787 | $614,900 | $360,800 | $254,100 |
| 2017 | $8,156 | $579,700 | $335,000 | $244,700 |
| 2016 | $8,140 | $584,800 | $335,000 | $249,800 |
| 2015 | $7,638 | $534,500 | $310,200 | $224,300 |
Source: Public Records
Map
Nearby Homes
- 65 Summit St
- 245 Oak Hill Cir
- 59 Lexington Dr
- 303 School St
- 66 Old Stow Rd
- 37 Water St
- 27 Water St
- 42 Sunnyside Ln
- 20 Westvale Meadows Unit C
- 116 Conant St
- 95 Conant St Unit 320
- 67 Conant St
- 1844 Main St Unit 1844
- 22 Center Village Dr
- 54 Maple St
- 100 Harrington Ave
- 102 Highland St
- 70 McCallar Ln
- 32 Highland St
- 53 Prairie St
- 69 Bayberry Rd
- 45 Bayberry Rd
- 64 Bayberry Rd
- 83 Bayberry Rd
- 52 Bayberry Rd
- 38 Bayberry Rd
- 29 Bayberry Rd
- 76 Bayberry Rd
- 26 Bayberry Rd
- 94 Bayberry Rd
- 63 Sorrel Rd
- 75 Sorrel Rd
- 490 Laws Brook Rd
- 468 Laws Brook Rd
- 51 Sorrel Rd
- 57 Shagbark Rd
- 480 Laws Brook Rd
- 452 Laws Brook Rd
- 37 Sorrel Rd
- 45 Shagbark Rd
Your Personal Tour Guide
Ask me questions while you tour the home.