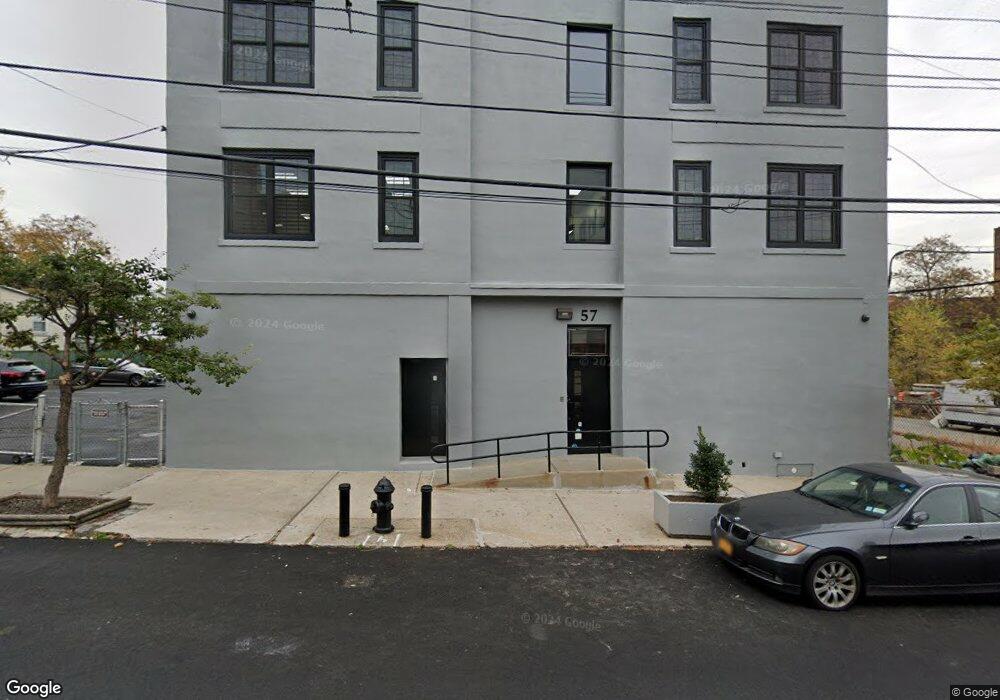
57 Beach St Unit 3rd Floor Staten Island, NY 10304
Stapleton Neighborhood
--
Bed
--
Bath
11,310
Sq Ft
5,663
Sq Ft Lot
About This Home
This home is located at 57 Beach St Unit 3rd Floor, Staten Island, NY 10304. 57 Beach St Unit 3rd Floor is a home located in Richmond County with nearby schools including P.S. 16 John J Driscoll, P.S. 74 Future Leaders Elementary School, and Fort Hill Collaborative Elementary.
Ownership History
Date
Name
Owned For
Owner Type
Purchase Details
Closed on
Jul 1, 2020
Sold by
57 Beach Street Llc
Bought by
57 Beach Llc
Home Financials for this Owner
Home Financials are based on the most recent Mortgage that was taken out on this home.
Original Mortgage
$900,000
Outstanding Balance
$796,565
Interest Rate
3%
Mortgage Type
Commercial
Purchase Details
Closed on
Nov 25, 2008
Sold by
Hall John G
Bought by
57 Beach Street Llc
Create a Home Valuation Report for This Property
The Home Valuation Report is an in-depth analysis detailing your home's value as well as a comparison with similar homes in the area
Home Values in the Area
Average Home Value in this Area
Purchase History
| Date | Buyer | Sale Price | Title Company |
|---|---|---|---|
| 57 Beach Llc | -- | Alr Abstract Services Llc | |
| 57 Beach Street Llc | -- | None Available |
Source: Public Records
Mortgage History
| Date | Status | Borrower | Loan Amount |
|---|---|---|---|
| Open | 57 Beach Llc | $900,000 |
Source: Public Records
Tax History Compared to Growth
Tax History
| Year | Tax Paid | Tax Assessment Tax Assessment Total Assessment is a certain percentage of the fair market value that is determined by local assessors to be the total taxable value of land and additions on the property. | Land | Improvement |
|---|---|---|---|---|
| 2025 | $45,996 | $468,900 | $123,300 | $345,600 |
| 2024 | $45,996 | $434,250 | $123,300 | $310,950 |
| 2023 | $50,743 | $476,640 | $120,600 | $356,040 |
| 2022 | $45,736 | $425,250 | $123,300 | $301,950 |
| 2021 | $47,016 | $439,650 | $123,300 | $316,350 |
| 2020 | $45,951 | $529,650 | $123,300 | $406,350 |
| 2019 | $44,470 | $547,200 | $109,800 | $437,400 |
| 2018 | $38,891 | $455,850 | $109,800 | $346,050 |
| 2017 | $27,556 | $514,800 | $109,800 | $405,000 |
| 2016 | $13,429 | $348,300 | $68,400 | $279,900 |
| 2015 | $5,650 | $322,200 | $68,400 | $253,800 |
| 2014 | $5,650 | $286,650 | $68,400 | $218,250 |
Source: Public Records
Map
Nearby Homes