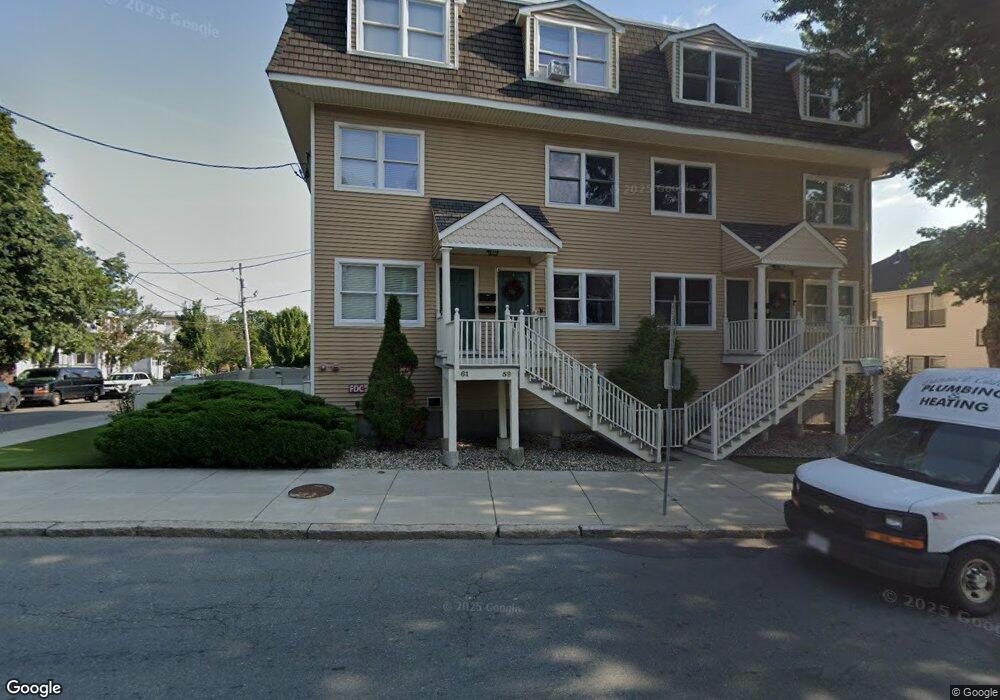
57 Belmont St Everett, MA 02149
West Everett NeighborhoodEstimated Value: $589,000 - $614,223
3
Beds
2
Baths
1,326
Sq Ft
$456/Sq Ft
Est. Value
About This Home
This home is located at 57 Belmont St, Everett, MA 02149 and is currently estimated at $605,056, approximately $456 per square foot. 57 Belmont St is a home located in Middlesex County with nearby schools including Everett High School and Pioneer Charter School of Science.
Ownership History
Date
Name
Owned For
Owner Type
Purchase Details
Closed on
Oct 28, 2025
Sold by
Addison Properties Llc
Bought by
Lhakchung
Current Estimated Value
Home Financials for this Owner
Home Financials are based on the most recent Mortgage that was taken out on this home.
Original Mortgage
$380,000
Outstanding Balance
$378,933
Interest Rate
6.35%
Mortgage Type
Purchase Money Mortgage
Estimated Equity
$226,123
Purchase Details
Closed on
Apr 11, 2008
Sold by
Mastrocola Dev Llc
Bought by
Addison Prop Llc
Create a Home Valuation Report for This Property
The Home Valuation Report is an in-depth analysis detailing your home's value as well as a comparison with similar homes in the area
Home Values in the Area
Average Home Value in this Area
Purchase History
| Date | Buyer | Sale Price | Title Company |
|---|---|---|---|
| Lhakchung | $599,000 | -- | |
| Addison Prop Llc | -- | -- | |
| Addison Prop Llc | -- | -- |
Source: Public Records
Mortgage History
| Date | Status | Borrower | Loan Amount |
|---|---|---|---|
| Open | Lhakchung | $380,000 |
Source: Public Records
Tax History
| Year | Tax Paid | Tax Assessment Tax Assessment Total Assessment is a certain percentage of the fair market value that is determined by local assessors to be the total taxable value of land and additions on the property. | Land | Improvement |
|---|---|---|---|---|
| 2025 | $6,140 | $539,100 | $0 | $539,100 |
| 2024 | $5,702 | $497,600 | $0 | $497,600 |
| 2023 | $5,881 | $499,200 | $0 | $499,200 |
| 2022 | $3,893 | $375,800 | $0 | $375,800 |
| 2021 | $3,565 | $361,200 | $0 | $361,200 |
| 2020 | $3,843 | $361,200 | $0 | $361,200 |
| 2019 | $4,254 | $343,600 | $0 | $343,600 |
| 2018 | $4,586 | $332,800 | $0 | $332,800 |
| 2017 | $4,266 | $295,400 | $0 | $295,400 |
| 2016 | $4,089 | $283,000 | $0 | $283,000 |
| 2015 | $4,075 | $278,900 | $0 | $278,900 |
Source: Public Records
Map
Nearby Homes
- 210 Hancock St
- 139 Bucknam St
- 340 Main St
- 80 Main St Unit 9
- 80 Main St Unit 4
- 48 Cleveland Ave
- 171 Bell Rock St Unit 171
- 67 Converse Ave Unit 69
- 21 Central Ave Unit 10
- 21 Staples Ave Unit 26
- 15 Staples Ave Unit 45
- 15 Staples Ave Unit 31
- 89 Judson St
- 120 Wyllis Ave Unit 217
- 120 Wyllis Ave Unit 401
- 82 Medford St Unit 2
- 56 Valley St
- 91-95 Medford St
- 17 Garland Ave
- 68 Linden St Unit 49
- 59 Belmont St
- 61 Belmont St
- 55 Belmont St
- 61 Belmont St Unit 61
- 61 Belmont St Unit 55
- 53 Belmont St
- 209 Bucknam St
- 112 Kinsman St
- 211 Bucknam St
- 54 Belmont St
- 205 Bucknam St
- 56 Belmont St
- 207 Bucknam St Unit 1
- 207 Bucknam St Unit 2
- 207 Bucknam St Unit 3
- 62 Belmont St
- 108 Kinsman St
- 46 Belmont St
- 66 Belmont St
- 115 Kinsman St
Your Personal Tour Guide
Ask me questions while you tour the home.