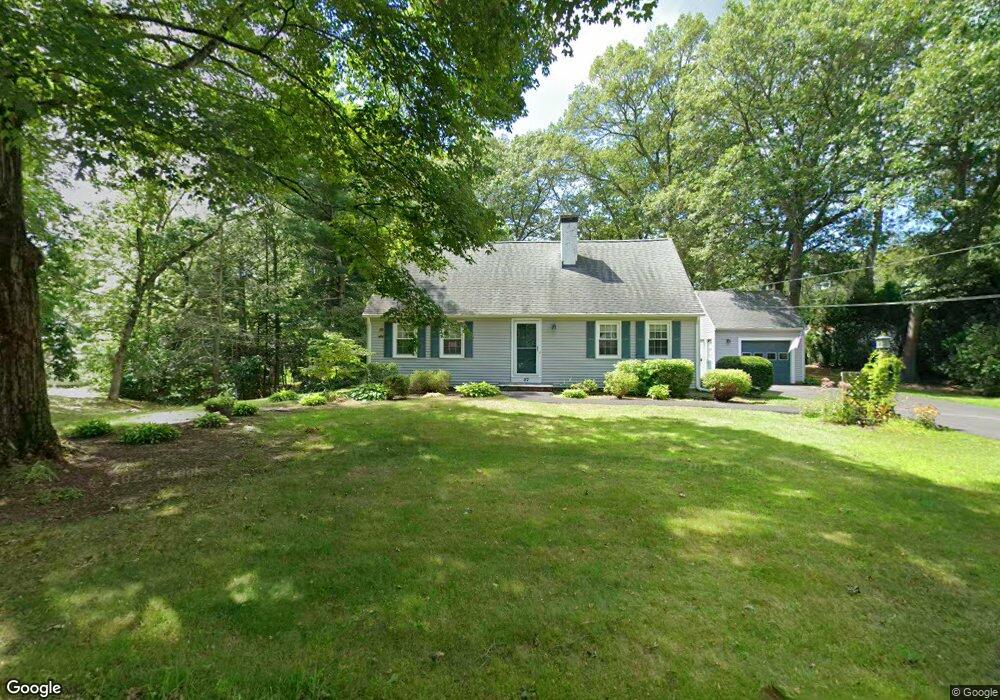
57 Black Oak Dr Attleboro, MA 02703
Estimated Value: $570,000 - $676,000
4
Beds
2
Baths
2,240
Sq Ft
$281/Sq Ft
Est. Value
About This Home
This home is located at 57 Black Oak Dr, Attleboro, MA 02703 and is currently estimated at $629,850, approximately $281 per square foot. 57 Black Oak Dr is a home located in Bristol County with nearby schools including A. Irvin Studley Elementary School, Cyril K. Brennan Middle School, and Attleboro High School.
Ownership History
Date
Name
Owned For
Owner Type
Purchase Details
Closed on
Feb 8, 2002
Sold by
Crandall John D and Crandall Mary L
Bought by
Mercier Jeffrey E and Mercier Kathleen
Current Estimated Value
Home Financials for this Owner
Home Financials are based on the most recent Mortgage that was taken out on this home.
Original Mortgage
$152,000
Interest Rate
7.13%
Mortgage Type
Purchase Money Mortgage
Create a Home Valuation Report for This Property
The Home Valuation Report is an in-depth analysis detailing your home's value as well as a comparison with similar homes in the area
Home Values in the Area
Average Home Value in this Area
Purchase History
| Date | Buyer | Sale Price | Title Company |
|---|---|---|---|
| Mercier Jeffrey E | $252,500 | -- |
Source: Public Records
Mortgage History
| Date | Status | Borrower | Loan Amount |
|---|---|---|---|
| Open | Mercier Jeffrey E | $136,000 | |
| Closed | Mercier Jeffrey E | $152,000 | |
| Previous Owner | Mercier Jeffrey E | $50,000 | |
| Previous Owner | Mercier Jeffrey E | $60,000 |
Source: Public Records
Tax History Compared to Growth
Tax History
| Year | Tax Paid | Tax Assessment Tax Assessment Total Assessment is a certain percentage of the fair market value that is determined by local assessors to be the total taxable value of land and additions on the property. | Land | Improvement |
|---|---|---|---|---|
| 2025 | $6,940 | $553,000 | $168,900 | $384,100 |
| 2024 | $6,487 | $509,600 | $152,000 | $357,600 |
| 2023 | $6,271 | $458,100 | $153,500 | $304,600 |
| 2022 | $5,926 | $410,100 | $146,300 | $263,800 |
| 2021 | $5,630 | $380,400 | $140,800 | $239,600 |
| 2020 | $5,052 | $367,100 | $134,600 | $232,500 |
| 2019 | $4,957 | $355,500 | $132,100 | $223,400 |
| 2018 | $3,953 | $323,100 | $128,200 | $194,900 |
| 2017 | $4,586 | $315,200 | $125,100 | $190,100 |
| 2016 | $4,367 | $294,700 | $116,600 | $178,100 |
| 2015 | $4,128 | $280,600 | $116,600 | $164,000 |
| 2014 | $4,038 | $271,900 | $111,600 | $160,300 |
Source: Public Records
Map
Nearby Homes
- 31 Verndale Ave
- 804 County St
- 34 Hawthorne St
- 52 Hawthorne St
- 101 South Ave Unit 803
- 660 Thacher St Unit 1402
- 17 Jewel Ave
- 49 Bushee St
- 22 Oakland Ave Unit 1
- 24 Oakland Ave Unit 1
- 309 Thacher St
- 0 Tulip Unit 73410552
- 0 Tulip Unit 73407296
- 75 Grant St
- 3 Grant St
- 21 Dennis St
- 6 Perez St
- 124 Tiffany St
- 49 Dennis St
- 429 S Main St Unit 1
- 42 Hobbs St
- 27 Black Oak Dr
- 59 Black Oak Dr
- 0000 Stone Forest Estates
- 38 Black Oak Dr
- 36 Hobbs St
- 30 Black Oak Dr
- 58 Black Oak Dr
- 196 Birch St
- 394 Birch St
- 19 Black Oak Dr
- 49 Greenhill Ave
- 195 Birch St
- 39 Greenhill Ave
- 24 Hobbs St
- 20 Black Oak Dr
- 191 Birch St
- 186 Birch St
- 1 Stoney Brook Ln
- 187 Birch St