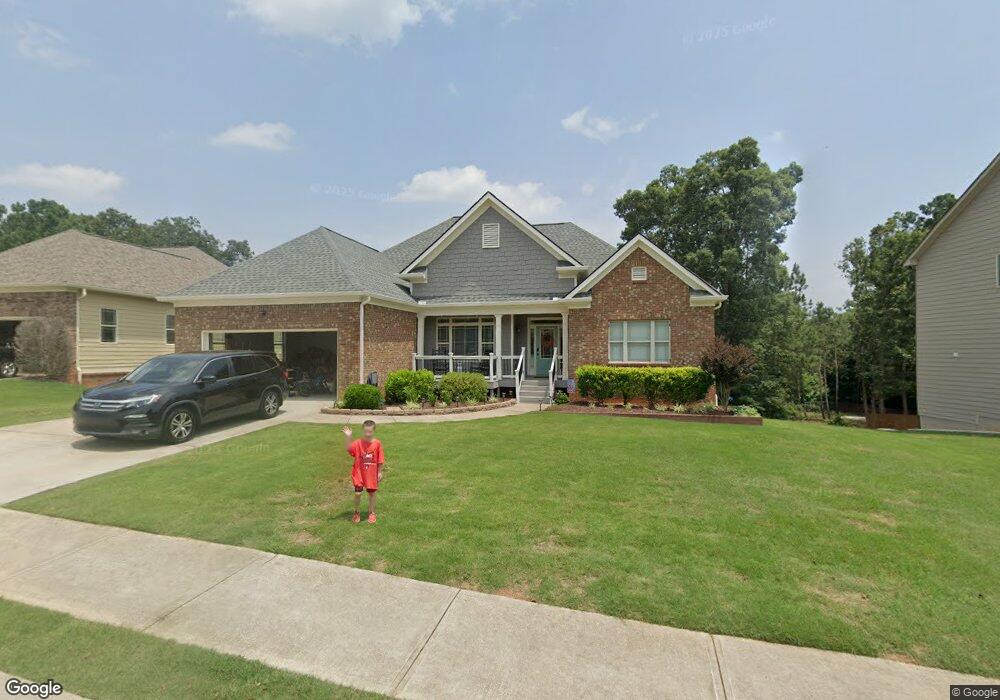
57 Braselton Farms Dr Unit 189 Hoschton, GA 30548
Estimated Value: $360,000 - $431,000
4
Beds
2
Baths
2,041
Sq Ft
$199/Sq Ft
Est. Value
About This Home
This home is located at 57 Braselton Farms Dr Unit 189, Hoschton, GA 30548 and is currently estimated at $406,208, approximately $199 per square foot. 57 Braselton Farms Dr Unit 189 is a home located in Jackson County with nearby schools including Gum Springs Elementary School, West Jackson Middle School, and Jackson County High School.
Ownership History
Date
Name
Owned For
Owner Type
Purchase Details
Closed on
Aug 10, 2018
Sold by
Wilbanks Cindy L
Bought by
Mitas Kathleen Elizabeth and Mitas Ryan David
Current Estimated Value
Home Financials for this Owner
Home Financials are based on the most recent Mortgage that was taken out on this home.
Original Mortgage
$207,000
Outstanding Balance
$179,771
Interest Rate
4.5%
Mortgage Type
New Conventional
Estimated Equity
$226,437
Purchase Details
Closed on
Jun 30, 2010
Sold by
Northeast Georgia Bank
Bought by
Wilbanks Cindy L
Home Financials for this Owner
Home Financials are based on the most recent Mortgage that was taken out on this home.
Original Mortgage
$180,568
Interest Rate
4.79%
Mortgage Type
FHA
Purchase Details
Closed on
Aug 4, 2009
Sold by
Crescent Ventures Llc
Bought by
Northeast Georgia Bank
Purchase Details
Closed on
Oct 11, 2006
Sold by
Not Provided
Bought by
Wilbanks Cindy L and Wilbanks Chad J
Create a Home Valuation Report for This Property
The Home Valuation Report is an in-depth analysis detailing your home's value as well as a comparison with similar homes in the area
Home Values in the Area
Average Home Value in this Area
Purchase History
| Date | Buyer | Sale Price | Title Company |
|---|---|---|---|
| Mitas Kathleen Elizabeth | $227,000 | -- | |
| Wilbanks Cindy L | $183,000 | -- | |
| Northeast Georgia Bank | $1,041,000 | -- | |
| Wilbanks Cindy L | $57,000 | -- |
Source: Public Records
Mortgage History
| Date | Status | Borrower | Loan Amount |
|---|---|---|---|
| Open | Mitas Kathleen Elizabeth | $207,000 | |
| Previous Owner | Northeast Georgia Bank | $180,568 |
Source: Public Records
Tax History Compared to Growth
Tax History
| Year | Tax Paid | Tax Assessment Tax Assessment Total Assessment is a certain percentage of the fair market value that is determined by local assessors to be the total taxable value of land and additions on the property. | Land | Improvement |
|---|---|---|---|---|
| 2024 | $3,840 | $145,080 | $18,000 | $127,080 |
| 2023 | $3,840 | $131,320 | $18,000 | $113,320 |
| 2022 | $3,034 | $101,600 | $10,000 | $91,600 |
| 2021 | $3,054 | $101,600 | $10,000 | $91,600 |
| 2020 | $2,771 | $84,000 | $10,000 | $74,000 |
| 2019 | $2,812 | $84,000 | $10,000 | $74,000 |
| 2018 | $2,669 | $80,480 | $10,000 | $70,480 |
| 2017 | $2,522 | $75,398 | $10,000 | $65,398 |
| 2016 | $2,536 | $75,398 | $10,000 | $65,398 |
| 2015 | $2,532 | $75,398 | $10,000 | $65,398 |
| 2014 | $2,490 | $74,021 | $10,000 | $64,021 |
| 2013 | -- | $74,021 | $10,000 | $64,021 |
Source: Public Records
Map
Nearby Homes
- 144 Braselton Farms Dr
- 387 Fern Ct
- 389 Aidens Bluff
- 363 Aidens Bluff
- 255 Lucas Ct
- 126 Summerhill Dr
- 565 Skelton Rd
- 1084 Skelton Rd
- 105 Creek View Dr
- 265 Laurel Cove Dr
- 485 Delaperriere Lot 44 D Loop
- 485 Delaperriere D Loop Unit LOT 44
- 1049 Amber Waves Ave
- 113 Skelton Rd
- 463 Delaperriere Loop
- 847 Wellford Ave
- 41 Doster Crest Rd
- 4457 Waxwing St
- 57 Braselton Farms Dr
- 77 Braselton Farms Dr
- 43 Braselton Farms Dr
- 95 Braselton Farms Dr
- 29 Braselton Farms Dr
- 309 Braselton Farms Trail
- 121 Braselton Farms Dr
- 310 Braselton Farms Trail
- 310 Braselton Farms Trail Unit 1
- 15 Braselton Farms Dr
- 0 Braselton Farms Trail Unit 8468191
- 0 Braselton Farms Trail Unit 8964856
- 0 Braselton Farms Trail Unit 7147532
- 0 Braselton Farms Trail Unit 7317035
- 0 Braselton Farms Trail Unit 7327729
- 143 Braselton Farms Dr
- 86 Braselton Farms Dr
- 86 Braselton Farms Dr Unit 9
- 319 Braselton Farms Trail
- 100 Braselton Farms Dr