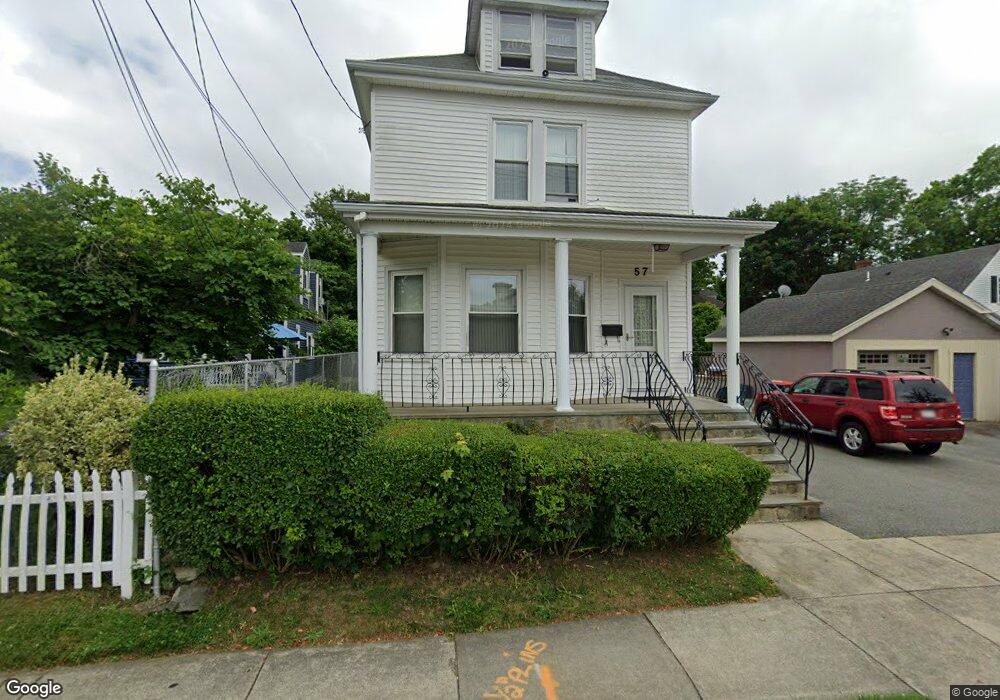
57 Bridge St Fairhaven, MA 02719
Estimated Value: $458,000 - $498,000
3
Beds
2
Baths
1,532
Sq Ft
$310/Sq Ft
Est. Value
About This Home
This home is located at 57 Bridge St, Fairhaven, MA 02719 and is currently estimated at $474,706, approximately $309 per square foot. 57 Bridge St is a home located in Bristol County with nearby schools including Fairhaven High School, City On A Hill Charter Public School New Bedford, and St. Joseph School.
Ownership History
Date
Name
Owned For
Owner Type
Purchase Details
Closed on
May 9, 2016
Sold by
Medeiros Maria E
Bought by
Medeiros Ft
Current Estimated Value
Purchase Details
Closed on
Dec 22, 1987
Sold by
Sylvia James
Bought by
Wall Thomas J
Home Financials for this Owner
Home Financials are based on the most recent Mortgage that was taken out on this home.
Original Mortgage
$100,000
Interest Rate
10.78%
Mortgage Type
Purchase Money Mortgage
Create a Home Valuation Report for This Property
The Home Valuation Report is an in-depth analysis detailing your home's value as well as a comparison with similar homes in the area
Home Values in the Area
Average Home Value in this Area
Purchase History
| Date | Buyer | Sale Price | Title Company |
|---|---|---|---|
| Medeiros Ft | -- | -- | |
| Wall Thomas J | $128,000 | -- |
Source: Public Records
Mortgage History
| Date | Status | Borrower | Loan Amount |
|---|---|---|---|
| Previous Owner | Wall Thomas J | $100,000 |
Source: Public Records
Tax History
| Year | Tax Paid | Tax Assessment Tax Assessment Total Assessment is a certain percentage of the fair market value that is determined by local assessors to be the total taxable value of land and additions on the property. | Land | Improvement |
|---|---|---|---|---|
| 2025 | $34 | $363,700 | $169,600 | $194,100 |
| 2024 | $3,266 | $353,900 | $169,600 | $184,300 |
| 2023 | $3,190 | $320,600 | $148,500 | $172,100 |
| 2022 | $3,099 | $303,200 | $138,000 | $165,200 |
| 2021 | $2,909 | $259,600 | $124,900 | $134,700 |
| 2020 | $2,826 | $259,600 | $124,900 | $134,700 |
| 2019 | $2,727 | $227,800 | $103,600 | $124,200 |
| 2018 | $2,559 | $216,900 | $98,600 | $118,300 |
| 2017 | $2,495 | $208,900 | $98,600 | $110,300 |
| 2016 | $2,432 | $199,700 | $98,600 | $101,100 |
| 2015 | $2,404 | $197,900 | $98,600 | $99,300 |
Source: Public Records
Map
Nearby Homes
Your Personal Tour Guide
Ask me questions while you tour the home.