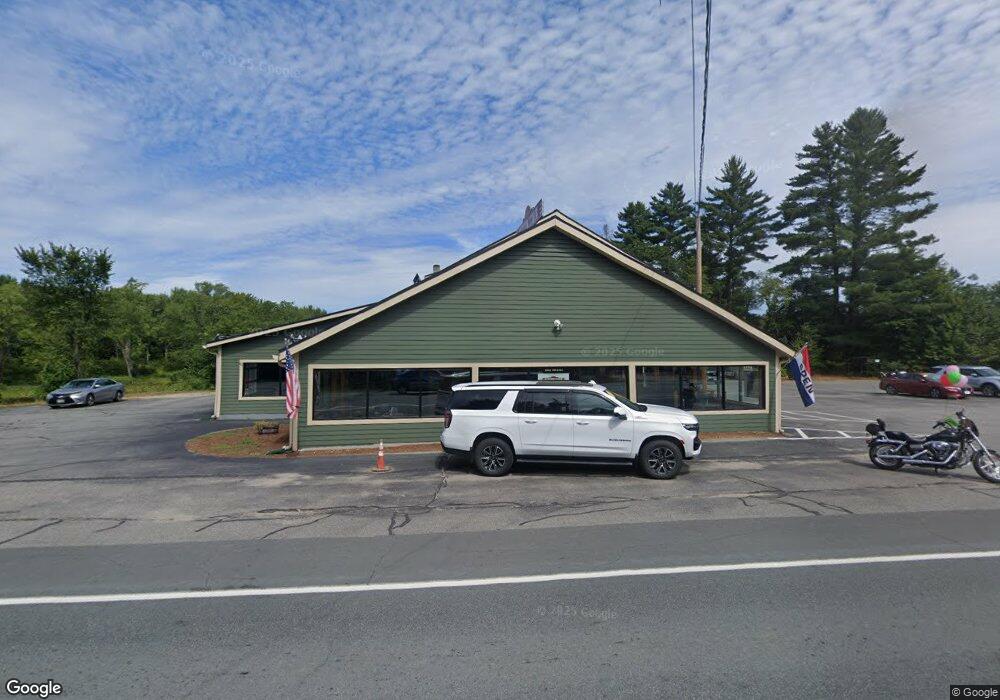
57 Bridge St Lancaster, NH 03584
Estimated Value: $330,545
2
Beds
2
Baths
7,119
Sq Ft
$46/Sq Ft
Est. Value
About This Home
This home is located at 57 Bridge St, Lancaster, NH 03584 and is currently estimated at $330,545, approximately $46 per square foot. 57 Bridge St is a home located in Coos County with nearby schools including Lancaster Elementary School, White Mountains Regional High School, and North Country Charter Academy Lancaster (M).
Ownership History
Date
Name
Owned For
Owner Type
Purchase Details
Closed on
Apr 21, 2004
Sold by
Rideout Leon H
Bought by
North Country Motor Sa
Current Estimated Value
Home Financials for this Owner
Home Financials are based on the most recent Mortgage that was taken out on this home.
Original Mortgage
$100,000
Outstanding Balance
$44,780
Interest Rate
5.4%
Mortgage Type
Commercial
Estimated Equity
$285,765
Create a Home Valuation Report for This Property
The Home Valuation Report is an in-depth analysis detailing your home's value as well as a comparison with similar homes in the area
Home Values in the Area
Average Home Value in this Area
Purchase History
| Date | Buyer | Sale Price | Title Company |
|---|---|---|---|
| North Country Motor Sa | $100,000 | -- |
Source: Public Records
Mortgage History
| Date | Status | Borrower | Loan Amount |
|---|---|---|---|
| Open | North Country Motor Sa | $100,000 |
Source: Public Records
Map
Nearby Homes
Your Personal Tour Guide
Ask me questions while you tour the home.