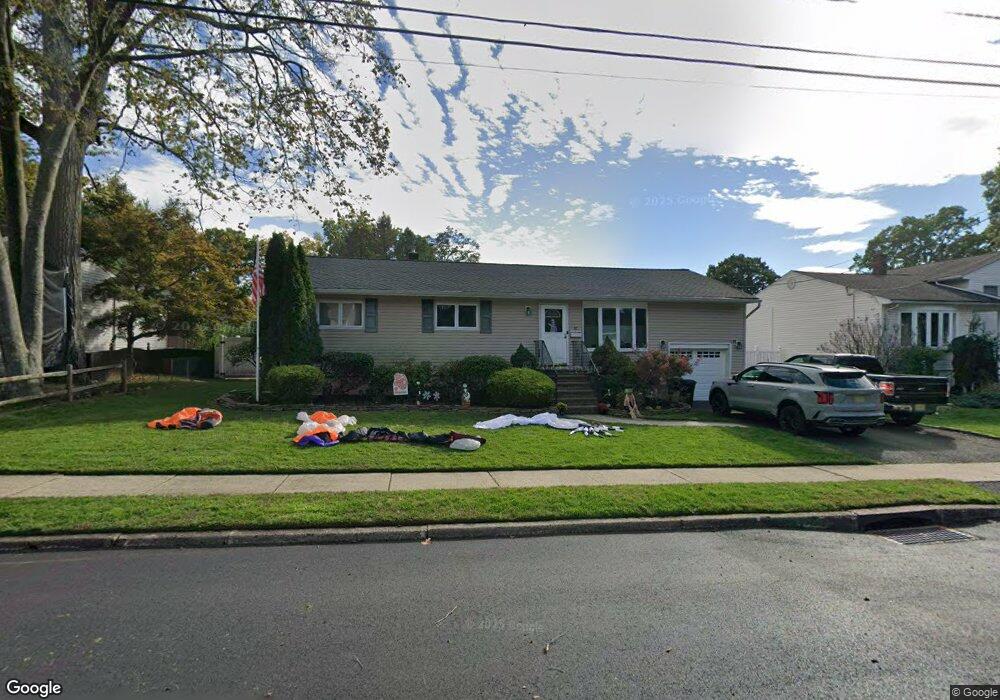
57 Cedar Rd Dumont, NJ 07628
Estimated Value: $631,000 - $696,000
Studio
--
Bath
1,070
Sq Ft
$618/Sq Ft
Est. Value
About This Home
This home is located at 57 Cedar Rd, Dumont, NJ 07628 and is currently estimated at $661,732, approximately $618 per square foot. 57 Cedar Rd is a home located in Bergen County with nearby schools including Dumont High School and Institute For Educational Achievement.
Ownership History
Date
Name
Owned For
Owner Type
Purchase Details
Closed on
Mar 29, 2018
Sold by
Amorosso Sam and Amorosso Joan
Bought by
Andino Nicole A and Cioffi Brian
Current Estimated Value
Purchase Details
Closed on
Oct 29, 1999
Sold by
Woyke Marie
Bought by
Amorosso Sam and Amorosso Joan
Create a Home Valuation Report for This Property
The Home Valuation Report is an in-depth analysis detailing your home's value as well as a comparison with similar homes in the area
Home Values in the Area
Average Home Value in this Area
Purchase History
| Date | Buyer | Sale Price | Title Company |
|---|---|---|---|
| Andino Nicole A | $350,000 | -- | |
| Amorosso Sam | $225,000 | Lawyers Title Insurance Corp |
Source: Public Records
Tax History
| Year | Tax Paid | Tax Assessment Tax Assessment Total Assessment is a certain percentage of the fair market value that is determined by local assessors to be the total taxable value of land and additions on the property. | Land | Improvement |
|---|---|---|---|---|
| 2025 | $13,671 | $559,700 | $335,100 | $224,600 |
| 2024 | $13,334 | $336,300 | $190,200 | $146,100 |
| 2023 | $13,059 | $336,300 | $190,200 | $146,100 |
| 2022 | $13,059 | $336,300 | $190,200 | $146,100 |
| 2021 | $12,995 | $336,300 | $190,200 | $146,100 |
| 2020 | $12,642 | $336,300 | $190,200 | $146,100 |
| 2019 | $12,339 | $336,300 | $190,200 | $146,100 |
| 2018 | $10,840 | $301,600 | $190,200 | $111,400 |
| 2017 | $10,631 | $301,600 | $190,200 | $111,400 |
| 2016 | $10,384 | $301,600 | $190,200 | $111,400 |
| 2015 | $9,896 | $301,600 | $190,200 | $111,400 |
| 2014 | $9,697 | $301,600 | $190,200 | $111,400 |
Source: Public Records
Map
Nearby Homes