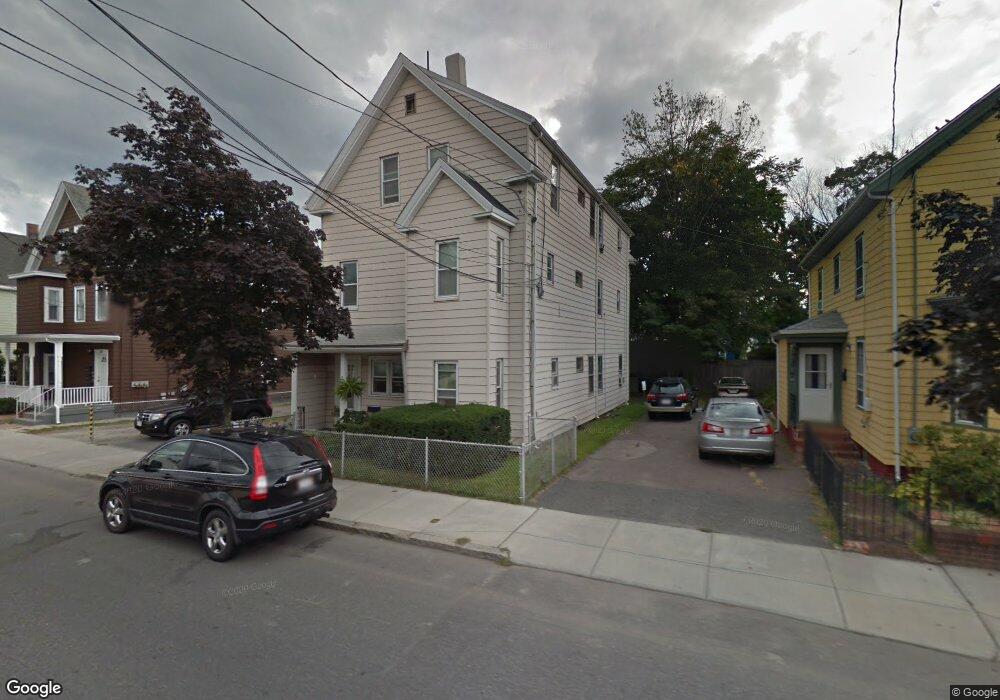
57 Cedar St Cambridge, MA 02140
North Cambridge Neighborhood
1
Bed
--
Bath
--
Sq Ft
--
Built
About This Home
Easy access to Porter Sq and Davis Square, Red T Lines, Harvard University and other area schools, shops, restaurants and parks
Create a Home Valuation Report for This Property
The Home Valuation Report is an in-depth analysis detailing your home's value as well as a comparison with similar homes in the area
Home Values in the Area
Average Home Value in this Area
Property History
| Date | Event | Price | List to Sale | Price per Sq Ft |
|---|---|---|---|---|
| 10/08/2024 10/08/24 | Off Market | $2,400 | -- | -- |
| 09/01/2024 09/01/24 | For Rent | $2,400 | -- | -- |
Tax History
| Year | Tax Paid | Tax Assessment Tax Assessment Total Assessment is a certain percentage of the fair market value that is determined by local assessors to be the total taxable value of land and additions on the property. | Land | Improvement |
|---|---|---|---|---|
| 2025 | $17,159 | $2,702,200 | $1,344,000 | $1,358,200 |
| 2024 | $16,569 | $2,798,800 | $1,374,000 | $1,424,800 |
| 2023 | $16,556 | $2,825,300 | $1,374,000 | $1,451,300 |
| 2022 | $15,357 | $2,594,100 | $1,284,000 | $1,310,100 |
| 2021 | $15,573 | $2,662,100 | $1,200,000 | $1,462,100 |
| 2020 | $14,174 | $2,465,000 | $1,170,000 | $1,295,000 |
| 2019 | $13,190 | $2,220,600 | $1,017,600 | $1,203,000 |
| 2018 | $12,470 | $1,982,500 | $885,000 | $1,097,500 |
| 2017 | $10,171 | $1,567,200 | $840,000 | $727,200 |
| 2016 | $9,782 | $1,399,400 | $642,000 | $757,400 |
| 2015 | $9,408 | $1,203,100 | $516,000 | $687,100 |
| 2014 | $9,088 | $1,084,500 | $480,000 | $604,500 |
Source: Public Records
Map
Nearby Homes
- 57 Cedar St
- 66 Reed Street Ct Unit 3
- 2353 Massachusetts Ave Unit 44
- 2353 Massachusetts Ave Unit 93
- 124 Jackson St
- 7A Meacham Rd Unit 7A
- 151 Sherman St
- 151 Sherman St Unit 151
- 108 Clay St
- 69 Harvey St Unit 1
- 49 Clifton St
- 126 Harvey St Unit 2
- 109 Harvey St
- 127 Harvey St
- 54 Bellis Cir
- 9-11 Edmunds St
- 11 Tannery Brook Row Unit 3
- 97 Elmwood St Unit 313
- 97 Elmwood St Unit 110
- 97 Elmwood St Unit 310
- 57 Cedar St Unit 3
- 57 Cedar St Unit 1
- 57 Cedar St Unit 5
- 57 Cedar St Unit 6
- 57 Cedar St Unit 2
- 57 Cedar St Unit 4
- 55 Cedar St
- 55 Cedar St Unit 3
- 55 Cedar St
- 55 Cedar St Unit 6
- 55 Cedar St Unit 5
- 55 Cedar St Unit 1
- 59 Cedar St
- 59 Cedar St Unit SL-2R
- 59 Cedar St Unit 2R
- 59 Cedar St Unit 1
- 59 Cedar St
- 59 Cedar St Unit 3
- 59 Cedar St Unit 6
- 59 Cedar St Unit 2L
Your Personal Tour Guide
Ask me questions while you tour the home.