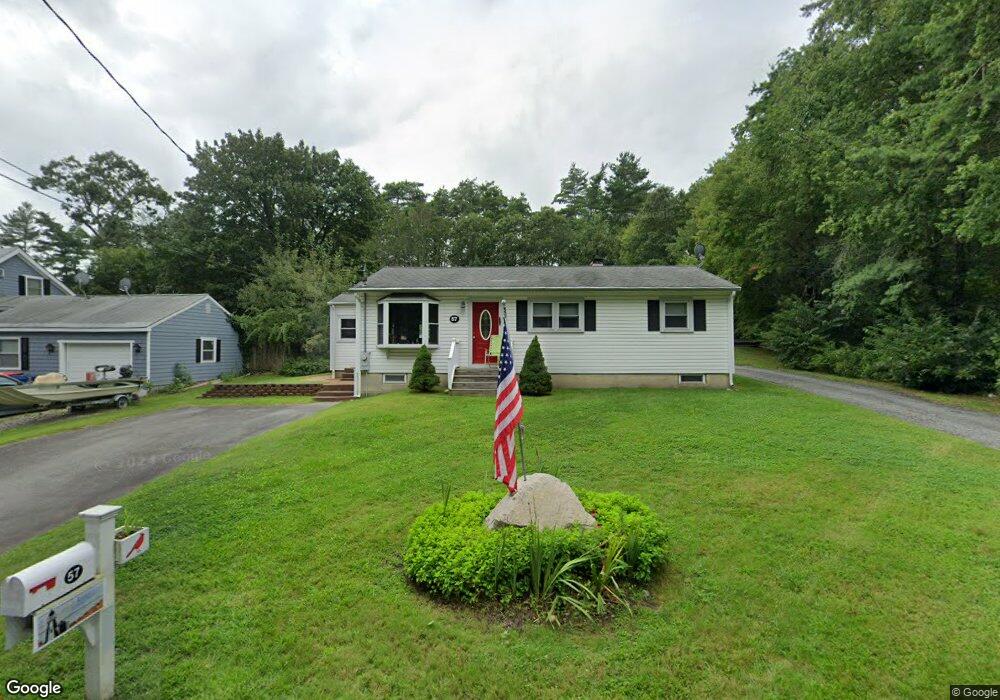
57 Center St Westport, MA 02790
North Westport NeighborhoodEstimated Value: $407,000 - $483,000
3
Beds
2
Baths
1,040
Sq Ft
$419/Sq Ft
Est. Value
About This Home
This home is located at 57 Center St, Westport, MA 02790 and is currently estimated at $435,831, approximately $419 per square foot. 57 Center St is a home located in Bristol County with nearby schools including Alice A. Macomber Primary School and Westport Elementary School.
Ownership History
Date
Name
Owned For
Owner Type
Purchase Details
Closed on
Nov 6, 2014
Sold by
Fielding John and Fielding Carol J
Bought by
Cabral Melissa and Fielding Shelly
Current Estimated Value
Purchase Details
Closed on
Mar 25, 1971
Bought by
Cabral Melissa and Fielding Shelly
Create a Home Valuation Report for This Property
The Home Valuation Report is an in-depth analysis detailing your home's value as well as a comparison with similar homes in the area
Home Values in the Area
Average Home Value in this Area
Purchase History
| Date | Buyer | Sale Price | Title Company |
|---|---|---|---|
| Cabral Melissa | -- | -- | |
| Cabral Melissa | -- | -- |
Source: Public Records
Mortgage History
| Date | Status | Borrower | Loan Amount |
|---|---|---|---|
| Previous Owner | Cabral Melissa | $25,000 | |
| Previous Owner | Cabral Melissa | $7,000 | |
| Previous Owner | Cabral Melissa | $16,000 | |
| Previous Owner | Cabral Melissa | $13,000 |
Source: Public Records
Tax History Compared to Growth
Tax History
| Year | Tax Paid | Tax Assessment Tax Assessment Total Assessment is a certain percentage of the fair market value that is determined by local assessors to be the total taxable value of land and additions on the property. | Land | Improvement |
|---|---|---|---|---|
| 2025 | $2,461 | $330,400 | $148,900 | $181,500 |
| 2024 | $2,455 | $317,600 | $138,000 | $179,600 |
| 2023 | $2,370 | $290,400 | $125,100 | $165,300 |
| 2022 | $2,229 | $262,900 | $118,900 | $144,000 |
| 2021 | $4,407 | $252,100 | $108,100 | $144,000 |
| 2020 | $4,291 | $242,300 | $98,300 | $144,000 |
| 2019 | $1,974 | $238,700 | $98,300 | $140,400 |
| 2018 | $4,274 | $191,800 | $85,700 | $106,100 |
| 2017 | $4,108 | $196,300 | $91,600 | $104,700 |
| 2016 | $1,484 | $187,600 | $86,900 | $100,700 |
| 2015 | $1,530 | $192,900 | $99,800 | $93,100 |
Source: Public Records
Map
Nearby Homes