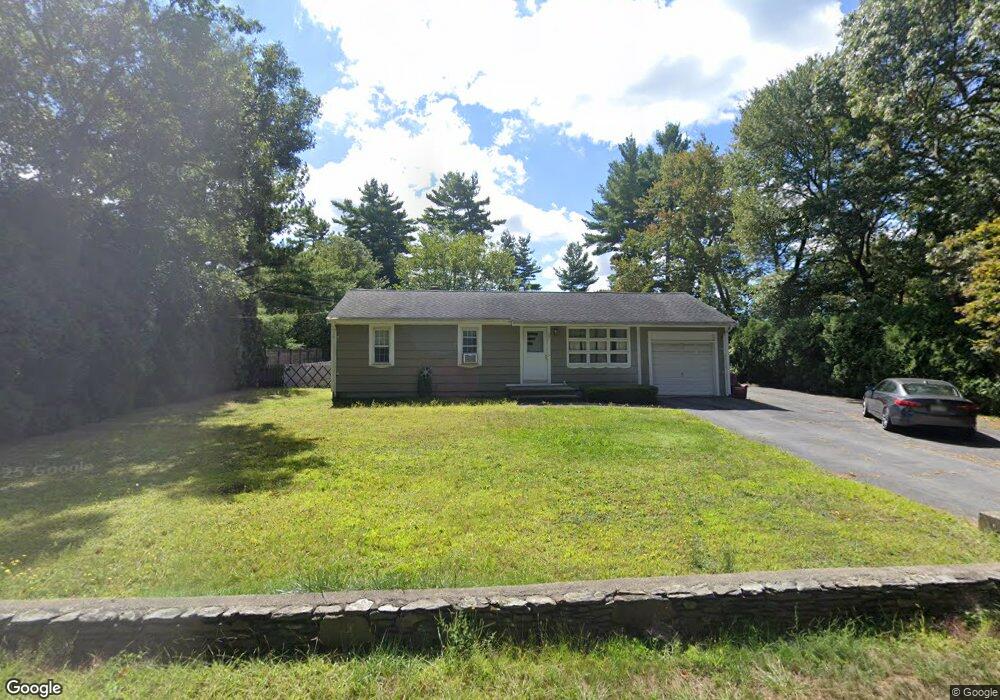
57 Chace Rd East Freetown, MA 02717
Estimated Value: $457,403 - $533,000
--
Bed
1
Bath
1,182
Sq Ft
$425/Sq Ft
Est. Value
About This Home
This home is located at 57 Chace Rd, East Freetown, MA 02717 and is currently estimated at $502,351, approximately $425 per square foot. 57 Chace Rd is a home located in Bristol County with nearby schools including Freetown Elementary School, George R Austin Intermediate School, and Freetown-Lakeville Middle School.
Ownership History
Date
Name
Owned For
Owner Type
Purchase Details
Closed on
Jun 17, 2015
Sold by
M&F Perreira Rt and Perreira Florence J
Bought by
R Perreira Rt and Perreira Robert L
Current Estimated Value
Purchase Details
Closed on
May 17, 2007
Sold by
Perreira Florence J
Bought by
M&F Perreira Rt and Perreira Florence J
Create a Home Valuation Report for This Property
The Home Valuation Report is an in-depth analysis detailing your home's value as well as a comparison with similar homes in the area
Home Values in the Area
Average Home Value in this Area
Purchase History
| Date | Buyer | Sale Price | Title Company |
|---|---|---|---|
| R Perreira Rt | $135,000 | -- | |
| M&F Perreira Rt | -- | -- |
Source: Public Records
Tax History Compared to Growth
Tax History
| Year | Tax Paid | Tax Assessment Tax Assessment Total Assessment is a certain percentage of the fair market value that is determined by local assessors to be the total taxable value of land and additions on the property. | Land | Improvement |
|---|---|---|---|---|
| 2025 | $3,893 | $392,800 | $156,600 | $236,200 |
| 2024 | $3,931 | $376,900 | $147,700 | $229,200 |
| 2023 | $3,803 | $355,100 | $133,000 | $222,100 |
| 2022 | $3,641 | $301,900 | $112,700 | $189,200 |
| 2021 | $3,506 | $276,100 | $102,500 | $173,600 |
| 2020 | $3,466 | $266,200 | $98,600 | $167,600 |
| 2019 | $3,290 | $250,200 | $93,800 | $156,400 |
| 2018 | $3,154 | $237,000 | $93,800 | $143,200 |
| 2017 | $3,077 | $231,000 | $93,800 | $137,200 |
| 2016 | $2,960 | $226,100 | $91,200 | $134,900 |
| 2015 | $2,593 | $201,000 | $91,200 | $109,800 |
| 2014 | $2,480 | $196,700 | $89,300 | $107,400 |
Source: Public Records
Map
Nearby Homes
- 0 Costa Dr
- 144 Chace Rd
- 9 Paul Ave
- 24 Bells Brook Rd
- 4597 Acushnet Ave
- 195 Slab Bridge Rd
- 599 Quanapoag Rd
- 1475 Braley Rd Unit 17
- 13 Luscomb Ln
- 16 Swallow St
- 5 Freetown St
- 1069 Cherokee St
- 319 Northwest St
- 269 Middleboro Rd
- 150 Quanapoag Rd
- 3 Abraham Ave
- 15 Morrison Way
- Lot 2/3 Quanapoag Rd
- 64 Blaze Rd
- 120 Hackett Ave