
Seller's Agent in 2022
Catherine St Pierre
Aluxety
(508) 641-6823
3 in this area
20 Total Sales
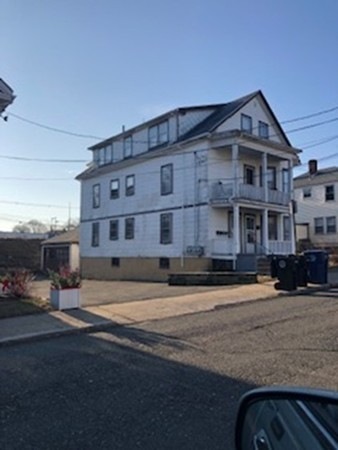
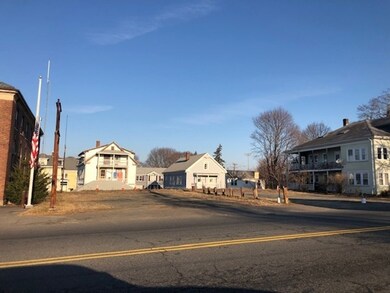
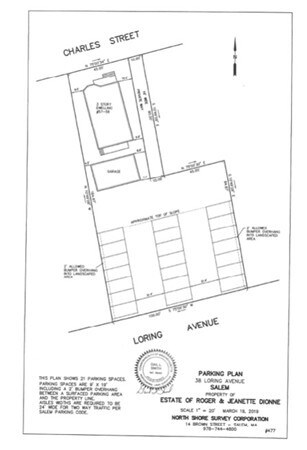
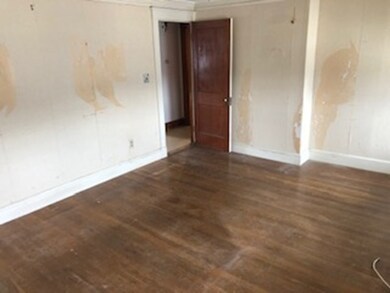
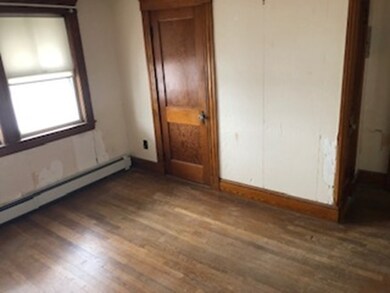
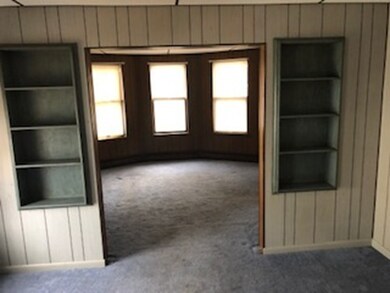
3 Family at 57-59 Charles St. Plus ajoining 38 Loring Ave, 21 car parking lot ."Across street from Salem State University".The 3 family will be VACANT and ready for new owner! Oversized garage 20'x32'. The plan attached shows 21 car parking @ $1200 each would generate another $25,000 per extra income.
| Date | Type | Sale Price | Title Company |
|---|---|---|---|
| Not Resolvable | $1,050,000 | None Available | |
| Personal Reps Deed | $655,000 | -- | |
| Deed | $95,000 | -- |
| Date | Status | Loan Amount | Loan Type |
|---|---|---|---|
| Open | $840,000 | Purchase Money Mortgage | |
| Previous Owner | $524,000 | Commercial | |
| Previous Owner | $88,700 | No Value Available | |
| Previous Owner | $100,000 | Purchase Money Mortgage |
| Date | Event | Price | Change | Sq Ft Price |
|---|---|---|---|---|
| 02/02/2022 02/02/22 | Sold | $1,050,000 | -12.5% | $309 / Sq Ft |
| 12/03/2021 12/03/21 | Pending | -- | -- | -- |
| 09/08/2021 09/08/21 | For Sale | $1,200,000 | +83.2% | $353 / Sq Ft |
| 08/16/2019 08/16/19 | Sold | $655,000 | -6.3% | $193 / Sq Ft |
| 06/18/2019 06/18/19 | Pending | -- | -- | -- |
| 06/11/2019 06/11/19 | Price Changed | $699,000 | -12.5% | $206 / Sq Ft |
| 06/08/2019 06/08/19 | Price Changed | $799,000 | -3.2% | $235 / Sq Ft |
| 05/13/2019 05/13/19 | For Sale | $825,000 | -- | $243 / Sq Ft |
| Year | Tax Paid | Tax Assessment Tax Assessment Total Assessment is a certain percentage of the fair market value that is determined by local assessors to be the total taxable value of land and additions on the property. | Land | Improvement |
|---|---|---|---|---|
| 2025 | $10,527 | $928,300 | $248,800 | $679,500 |
| 2024 | $9,725 | $836,900 | $236,500 | $600,400 |
| 2023 | $9,488 | $758,400 | $218,300 | $540,100 |
| 2022 | $9,173 | $692,300 | $211,000 | $481,300 |
| 2021 | $8,795 | $637,300 | $196,400 | $440,900 |
| 2020 | $7,674 | $531,100 | $185,500 | $345,600 |
| 2019 | $7,612 | $504,100 | $176,100 | $328,000 |
| 2018 | $7,082 | $460,500 | $167,300 | $293,200 |
| 2017 | $6,612 | $416,900 | $141,200 | $275,700 |
| 2016 | $6,429 | $410,300 | $134,600 | $275,700 |
| 2015 | $6,267 | $381,900 | $123,700 | $258,200 |
Seller's Agent in 2022
Catherine St Pierre
Aluxety
(508) 641-6823
3 in this area
20 Total Sales
J
Seller's Agent in 2019
Jack Hyland Jr.
John L. Hyland Jr.
4 Total Sales
Source: MLS Property Information Network (MLS PIN)
MLS Number: 72499037
APN: SALE-000032-000000-000080
Disclaimer: Certain information contained herein is derived from information provided by parties other than Homes.com. All information provided is deemed reliable, but is not guaranteed to be accurate and should be independently verified.
![]() The property listing data and information, or the Images, set forth herein were provided to MLS Property Information Network, Inc. from third party sources, including sellers, lessors and public records, and were compiled by MLS Property Information Network, Inc. The property listing data and information, and the Images, are for the personal, non-commercial use of consumers having a good faith interest in purchasing or leasing listed properties of the type displayed to them and may not be used for any purpose other than to identify prospective properties which such consumers may have a good faith interest in purchasing or leasing. MLS Property Information Network, Inc. and its subscribers disclaim any and all representations and warranties as to the accuracy of the property listing data and information, or as to the accuracy of any of the Images, set forth herein.
The property listing data and information, or the Images, set forth herein were provided to MLS Property Information Network, Inc. from third party sources, including sellers, lessors and public records, and were compiled by MLS Property Information Network, Inc. The property listing data and information, and the Images, are for the personal, non-commercial use of consumers having a good faith interest in purchasing or leasing listed properties of the type displayed to them and may not be used for any purpose other than to identify prospective properties which such consumers may have a good faith interest in purchasing or leasing. MLS Property Information Network, Inc. and its subscribers disclaim any and all representations and warranties as to the accuracy of the property listing data and information, or as to the accuracy of any of the Images, set forth herein.