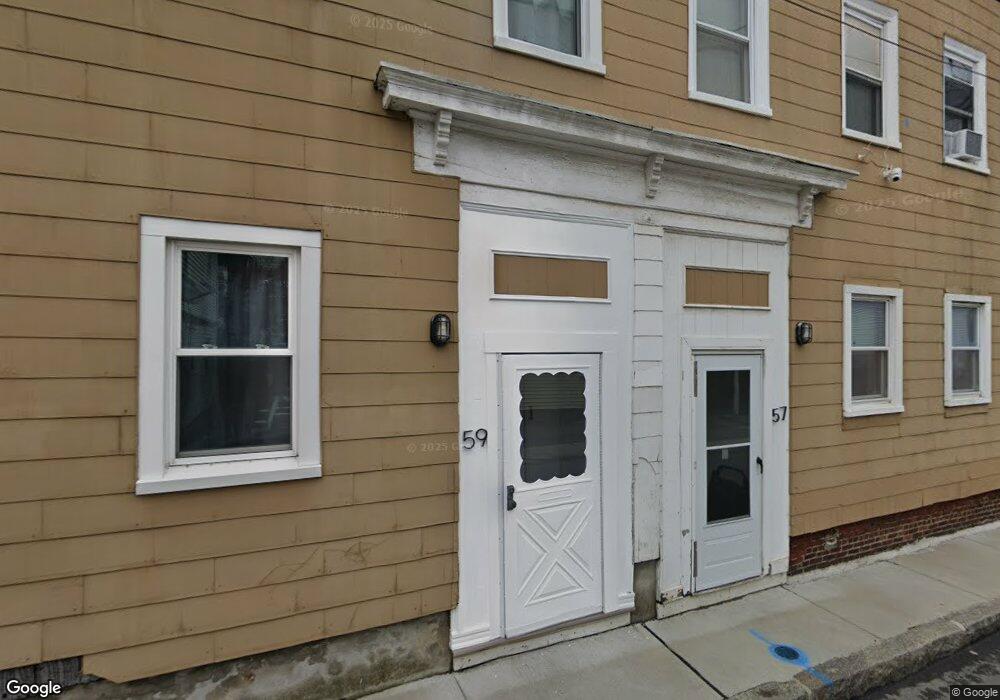
57 Cherry St Unit 1 Chelsea, MA 02150
Broadway NeighborhoodEstimated Value: $406,000 - $518,090
3
Beds
2
Baths
1,113
Sq Ft
$401/Sq Ft
Est. Value
About This Home
This home is located at 57 Cherry St Unit 1, Chelsea, MA 02150 and is currently estimated at $445,773, approximately $400 per square foot. 57 Cherry St Unit 1 is a home located in Suffolk County with nearby schools including Chelsea High School and Phoenix Charter Academy - Chelsea.
Ownership History
Date
Name
Owned For
Owner Type
Purchase Details
Closed on
Nov 19, 2024
Sold by
Pineda Christine
Bought by
Sagastume Estela D and Gutierrez Hector M
Current Estimated Value
Home Financials for this Owner
Home Financials are based on the most recent Mortgage that was taken out on this home.
Original Mortgage
$348,600
Outstanding Balance
$345,130
Interest Rate
6.12%
Mortgage Type
Purchase Money Mortgage
Estimated Equity
$100,643
Purchase Details
Closed on
Mar 18, 2013
Sold by
Berk Baris
Bought by
Pineda Christine
Home Financials for this Owner
Home Financials are based on the most recent Mortgage that was taken out on this home.
Original Mortgage
$146,723
Interest Rate
3.75%
Mortgage Type
FHA
Purchase Details
Closed on
Oct 23, 2012
Sold by
Bank Of New York Mello
Bought by
Berk Baris
Purchase Details
Closed on
Jun 6, 2012
Sold by
Keane Darren J
Bought by
Bank Of New York Mello
Purchase Details
Closed on
May 16, 2003
Sold by
Vasco Delsa
Bought by
Keanne Derek D
Create a Home Valuation Report for This Property
The Home Valuation Report is an in-depth analysis detailing your home's value as well as a comparison with similar homes in the area
Home Values in the Area
Average Home Value in this Area
Purchase History
| Date | Buyer | Sale Price | Title Company |
|---|---|---|---|
| Sagastume Estela D | $415,000 | None Available | |
| Sagastume Estela D | $415,000 | None Available | |
| Sagastume Estela D | $415,000 | None Available | |
| Pineda Christine | $149,500 | -- | |
| Pineda Christine | $149,500 | -- | |
| Berk Baris | $75,000 | -- | |
| Bank Of New York Mello | $180,661 | -- | |
| Keanne Derek D | $130,500 | -- | |
| Pineda Christine | $149,500 | -- | |
| Berk Baris | $75,000 | -- | |
| Bank Of New York Mello | $180,661 | -- | |
| Keanne Derek D | $130,500 | -- |
Source: Public Records
Mortgage History
| Date | Status | Borrower | Loan Amount |
|---|---|---|---|
| Open | Sagastume Estela D | $348,600 | |
| Closed | Sagastume Estela D | $348,600 | |
| Previous Owner | Pineda Christine | $146,723 | |
| Previous Owner | Keanne Derek D | $195,000 |
Source: Public Records
Tax History Compared to Growth
Tax History
| Year | Tax Paid | Tax Assessment Tax Assessment Total Assessment is a certain percentage of the fair market value that is determined by local assessors to be the total taxable value of land and additions on the property. | Land | Improvement |
|---|---|---|---|---|
| 2025 | $4,202 | $365,100 | $119,100 | $246,000 |
| 2024 | $4,183 | $351,500 | $119,100 | $232,400 |
| 2023 | $3,947 | $318,800 | $108,200 | $210,600 |
| 2022 | $3,960 | $298,900 | $103,100 | $195,800 |
| 2021 | $3,842 | $282,100 | $98,200 | $183,900 |
| 2020 | $3,582 | $267,500 | $93,500 | $174,000 |
| 2019 | $3,091 | $216,900 | $93,500 | $123,400 |
| 2018 | $2,804 | $198,900 | $93,500 | $105,400 |
| 2017 | $2,733 | $190,600 | $93,500 | $97,100 |
| 2016 | $2,558 | $179,500 | $93,500 | $86,000 |
| 2015 | $2,239 | $155,500 | $81,300 | $74,200 |
| 2014 | $2,189 | $147,100 | $70,700 | $76,400 |
Source: Public Records
Map
Nearby Homes
- 40 Williams St Unit C
- 100 Pearl St Unit 2
- 78 Winnisimmet St
- 68 Pearl St
- 16 Tremont St Unit 2
- 103 Broadway
- 77 Pearl St Unit 3
- 23 Division St
- 60 Beacon St Unit 2
- 34 Tremont St Unit 6
- 10 Beacon St Unit 1
- 23 Chestnut St Unit 5
- 10 Eldridge Place
- 30 High St
- 192 Chestnut St
- 17 Suffolk St
- 84 Captains Row Unit 84
- 173 Walnut St Unit 3
- 230 Chestnut St
- 1 Boatswains Way
- 59 Cherry St
- 59 Cherry St Unit 59
- 55 Cherry St Unit 3
- 55 Cherry St Unit 1
- 55 Cherry St Unit 2
- 55 Cherry St
- 61 Cherry St
- 168 Broadway
- 54 Cherry St Unit 1
- 54 Cherry St
- 164 Broadway
- 56 Cherry St
- 162 Broadway
- 60 Cherry St
- 160 Broadway
- 160 Broadway Unit store
- 160 Broadway Unit 3F
- 64 Cherry St
- 50 Cherry St
- 24 2nd St