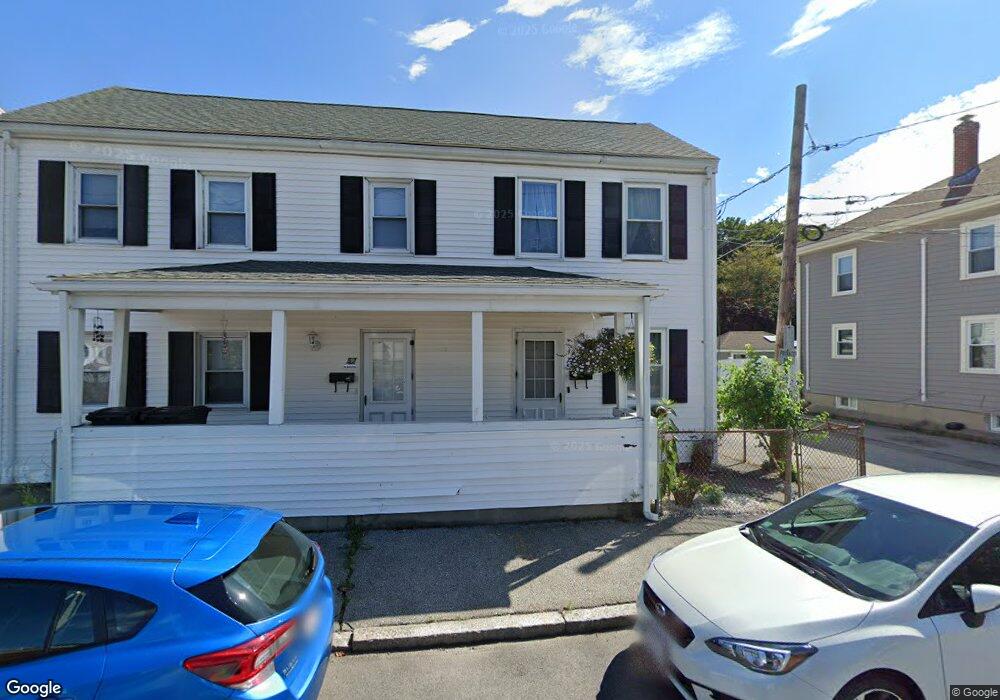
57 Conn St Woburn, MA 01801
Downtown Woburn NeighborhoodEstimated Value: $698,658 - $895,000
3
Beds
2
Baths
2,359
Sq Ft
$343/Sq Ft
Est. Value
About This Home
This home is located at 57 Conn St, Woburn, MA 01801 and is currently estimated at $809,415, approximately $343 per square foot. 57 Conn St is a home located in Middlesex County with nearby schools including Goodyear Elementary School, Daniel L. Joyce Middle School, and Woburn High School.
Ownership History
Date
Name
Owned For
Owner Type
Purchase Details
Closed on
Jun 11, 2014
Sold by
Pellegrino Dean
Bought by
Commonwealth Inv Props
Current Estimated Value
Purchase Details
Closed on
Sep 24, 2010
Sold by
Fhlmc
Bought by
Pellegrino Dean
Purchase Details
Closed on
Apr 27, 2010
Sold by
Fagan David M and Bac Gp Llc
Bought by
Fhlmc
Purchase Details
Closed on
Oct 13, 2009
Sold by
Fagan David M and Fagan Erica L
Bought by
Fagan David M
Purchase Details
Closed on
Jul 16, 2001
Sold by
Griffin Brian E and Griffin Joan H
Bought by
Fagan David M and Fagan Erica L
Home Financials for this Owner
Home Financials are based on the most recent Mortgage that was taken out on this home.
Original Mortgage
$220,500
Interest Rate
7.2%
Mortgage Type
Purchase Money Mortgage
Create a Home Valuation Report for This Property
The Home Valuation Report is an in-depth analysis detailing your home's value as well as a comparison with similar homes in the area
Home Values in the Area
Average Home Value in this Area
Purchase History
| Date | Buyer | Sale Price | Title Company |
|---|---|---|---|
| Commonwealth Inv Props | -- | -- | |
| Commonwealth Inv Props | -- | -- | |
| Pellegrino Dean | $185,000 | -- | |
| Pellegrino Dean | $185,000 | -- | |
| Fhlmc | $295,356 | -- | |
| Fhlmc | $295,356 | -- | |
| Fagan David M | -- | -- | |
| Fagan David M | -- | -- | |
| Fagan David M | $245,000 | -- |
Source: Public Records
Mortgage History
| Date | Status | Borrower | Loan Amount |
|---|---|---|---|
| Previous Owner | Fagan David M | $220,500 |
Source: Public Records
Tax History Compared to Growth
Tax History
| Year | Tax Paid | Tax Assessment Tax Assessment Total Assessment is a certain percentage of the fair market value that is determined by local assessors to be the total taxable value of land and additions on the property. | Land | Improvement |
|---|---|---|---|---|
| 2025 | $4,798 | $561,800 | $251,300 | $310,500 |
| 2024 | $4,366 | $541,700 | $239,300 | $302,400 |
| 2023 | $4,412 | $507,100 | $217,600 | $289,500 |
| 2022 | $4,321 | $462,600 | $189,200 | $273,400 |
| 2021 | $4,232 | $453,600 | $180,200 | $273,400 |
| 2020 | $3,851 | $413,200 | $180,200 | $233,000 |
| 2019 | $3,629 | $382,000 | $171,600 | $210,400 |
| 2018 | $3,587 | $362,700 | $157,400 | $205,300 |
| 2017 | $3,130 | $314,900 | $149,900 | $165,000 |
| 2016 | $2,952 | $293,700 | $140,100 | $153,600 |
| 2015 | $2,894 | $284,600 | $131,000 | $153,600 |
| 2014 | $2,921 | $279,800 | $131,000 | $148,800 |
Source: Public Records
Map
Nearby Homes
- 61 Mount Pleasant St
- 64 Garfield Ave
- 39 Garfield Ave
- 14 Ash St
- 69 Eastern Ave
- 35 Prospect St Unit 215
- 35 Prospect St Unit 204
- 44 Main St
- 15 Sturgis St
- 14 Cross St
- 62 Jefferson Ave
- 7 Prospect St
- 2 George Rd Unit 2
- 51 Vernon St
- 29 Arlington Rd Unit 4
- 27 Arlington Rd Unit 1-6
- 2 Eastern Ave
- 52 Pleasant St
- 31 Arlington Rd Unit 1-6
- 34 Union St
- 59 Conn St
- 53 Conn St
- 51 Conn St
- 61 Conn St Unit 1
- 65 Conn St Unit 4
- 63 Conn St Unit 3
- 65 Conn St Unit 65
- 55 Conn St Unit 1
- 49 Conn St Unit R
- 49r Conn St
- 67 Conn St
- 69 Conn St
- 67 Conn St Unit 69
- 69 Conn St Unit 1
- 69 Conn St Unit 69
- 67 Conn St Unit 2
- 69 Conn St Unit 2
- 69 Conn St
- 67 Conn St Unit 67
- 45 Conn St