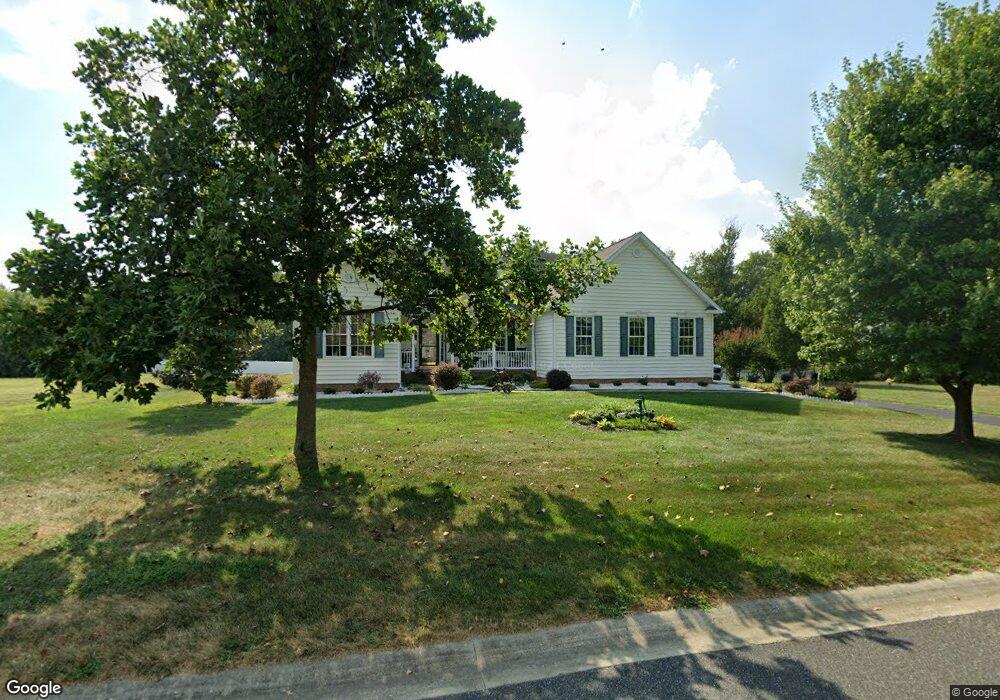
57 Cordray Ct Clayton, DE 19938
Estimated Value: $503,000 - $647,000
About This Home
This home is located at 57 Cordray Ct, Clayton, DE 19938 and is currently estimated at $552,249, approximately $219 per square foot. 57 Cordray Ct is a home located in Kent County with nearby schools including Clayton Elementary School, John Bassett Moore Intermediate School, and Smyrna Middle School.
Ownership History
We collect this data history from publicly available records. To have your information removed, we recommend requesting removal directly through your county’s website.
Purchase Details
Purchase Details
Home Financials for this Owner
Home Financials are based on the most recent Mortgage that was taken out on this home.Home Values in the Area
Average Home Value in this Area
Purchase History
We collect this data history from publicly available records. To have your information removed, we recommend requesting removal directly through your county’s website.
| Date | Buyer | Sale Price | Title Company |
|---|---|---|---|
| -- | None Available | ||
| -- | None Available |
Mortgage History
We collect this data history from publicly available records. To have your information removed, we recommend requesting removal directly through your county’s website.
| Date | Status | Borrower | Loan Amount |
|---|---|---|---|
| Previous Owner | $368,900 |
Tax History
We collect this data history from publicly available records. To have your information removed, we recommend requesting removal directly through your county’s website.
| Year | Tax Paid | Tax Assessment Tax Assessment Total Assessment is a certain percentage of the fair market value that is determined by local assessors to be the total taxable value of land and additions on the property. | Land | Improvement |
|---|---|---|---|---|
| 2025 | $1,928 | $473,000 | $112,700 | $360,300 |
| 2024 | $1,911 | $473,000 | $112,700 | $360,300 |
| 2023 | $1,908 | $74,600 | $6,500 | $68,100 |
| 2022 | $1,811 | $74,600 | $6,500 | $68,100 |
| 2021 | $1,865 | $74,600 | $6,500 | $68,100 |
| 2020 | $1,618 | $74,600 | $6,500 | $68,100 |
| 2019 | $1,631 | $74,600 | $6,500 | $68,100 |
| 2018 | $1,629 | $74,600 | $6,500 | $68,100 |
| 2017 | $1,627 | $74,600 | $0 | $0 |
| 2016 | $1,994 | $74,600 | $0 | $0 |
| 2015 | $2,003 | $74,600 | $0 | $0 |
| 2014 | $1,892 | $74,600 | $0 | $0 |
Map
- 988 Cool Breeze Dr
- 195 Winnow Dr
- 127 Amalfi Dr
- 160 Conach Ln
- 203 Villa Dr
- 149 Villa Dr
- 410 West St
- 404 West St
- 320 Smyrna Ave
- 0 Wheatleys Pond Rd
- 114 Christiana River Dr
- 6 Dover Cir
- 201 S Rodney St
- 0 Kirkwood St
- 28 Snow Branch Rd
- 375 Delaware River Dr
- 86 Smyrna Ave
- 978 Blackbird Forest Rd
- 1853 Vandyke Greenspring Rd
- 232 W Pembrooke Dr
- 156 Colburn Dr
- 17 Cordray Ct
- 157 Colburn Dr
- 171 Colburn Dr
- 133 Colburn Dr
- 115 Colburn Dr
- 79 Cordray Ct
- 18 Cordray Ct
- 44 Cordray Ct
- 93 Colburn Dr
- 60 Cordray Ct
- 71 Colburn Dr
- 5077 Millington Rd
- 51 Laristone Ct
- 53 Colburn Dr
- 5123 Millington Rd
- 5003 Millington Rd
- 143 Laristone Ct
- 29 Colburn Dr
- 183 Laristone Ct
Ask me questions while you tour the home.