57 Cross Bow Ln West Warwick, RI 02893
Crompton NeighborhoodEstimated Value: $427,000 - $516,000
About This Home
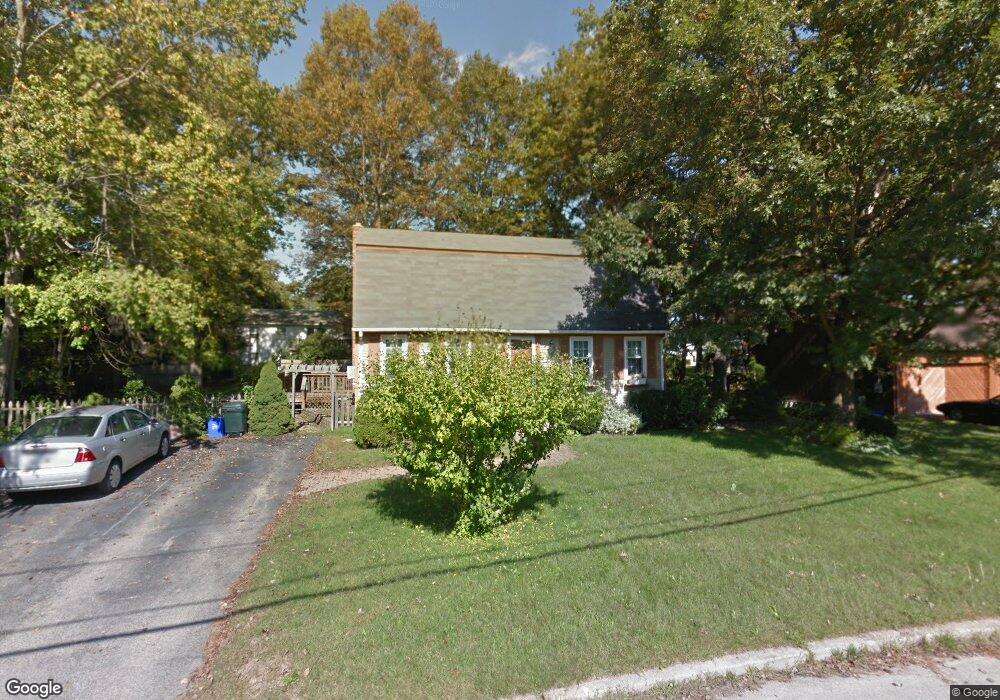
This home is located at 57 Cross Bow Ln, West Warwick, RI 02893 and is currently estimated at $486,603, approximately $231 per square foot. 57 Cross Bow Ln is a home located in Kent County with nearby schools including West Warwick High School and Father John V. Doyle School.
Ownership History
We collect this data history from publicly available records. To have your information removed, we recommend requesting removal directly through your county’s website.
Purchase Details
Home Financials for this Owner
Home Financials are based on the most recent Mortgage that was taken out on this home.Home Values in the Area
Average Home Value in this Area
Purchase History
We collect this data history from publicly available records. To have your information removed, we recommend requesting removal directly through your county’s website.
| Date | Buyer | Sale Price | Title Company |
|---|---|---|---|
| $203,000 | -- |
Mortgage History
We collect this data history from publicly available records. To have your information removed, we recommend requesting removal directly through your county’s website.
| Date | Status | Borrower | Loan Amount |
|---|---|---|---|
| Open | $197,853 | ||
| Previous Owner | $50,000 | ||
| Previous Owner | $105,000 | ||
| Previous Owner | $28,000 |
Tax History
We collect this data history from publicly available records. To have your information removed, we recommend requesting removal directly through your county’s website.
| Year | Tax Paid | Tax Assessment Tax Assessment Total Assessment is a certain percentage of the fair market value that is determined by local assessors to be the total taxable value of land and additions on the property. | Land | Improvement |
|---|---|---|---|---|
| 2025 | $6,433 | $450,200 | $114,500 | $335,700 |
| 2024 | $5,917 | $316,600 | $90,400 | $226,200 |
| 2023 | $5,800 | $316,600 | $90,400 | $226,200 |
| 2022 | $5,656 | $313,500 | $90,400 | $223,100 |
| 2021 | $5,667 | $246,400 | $72,300 | $174,100 |
| 2020 | $5,667 | $246,400 | $72,300 | $174,100 |
| 2019 | $7,224 | $246,400 | $72,300 | $174,100 |
| 2018 | $5,151 | $189,500 | $70,200 | $119,300 |
| 2017 | $4,986 | $189,500 | $70,200 | $119,300 |
| 2016 | $4,897 | $189,500 | $70,200 | $119,300 |
| 2015 | $4,948 | $190,600 | $70,200 | $120,400 |
| 2014 | $1,210 | $190,600 | $70,200 | $120,400 |
Map
- 20 Rotary Dr
- 59 Scenic Dr
- 5 Lions Dr
- 0 New London Turnpike
- 1 Hampton Rd Unit 27
- 19 Hampton Rd Unit 69
- 15 Hampton Rd Unit 20
- 15 Justin Rd
- 64 Red Brook Ln Unit 64
- 36 Martin St
- 2406 Division Rd
- 294 E Greenwich Ave
- 83 Nicole Dr
- 7 Englewood Rd
- 1785 Division Rd
- 35 Beech Crest Rd
- 4 Stonecarry Way
- 137 Signal Ridge Way
- 81 Lonsdale St
- 45 Lonsdale St
Ask me questions while you tour the home.