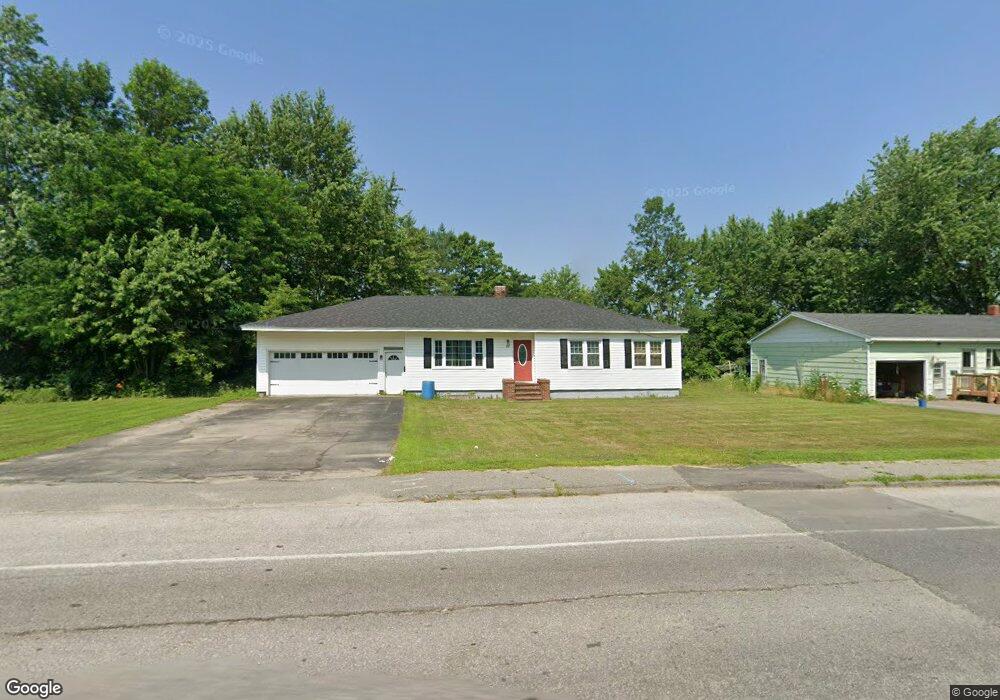
57 Cushman Rd Winslow, ME 04901
Estimated Value: $283,334 - $298,000
3
Beds
1
Bath
1,388
Sq Ft
$211/Sq Ft
Est. Value
About This Home
This home is located at 57 Cushman Rd, Winslow, ME 04901 and is currently estimated at $293,084, approximately $211 per square foot. 57 Cushman Rd is a home located in Kennebec County with nearby schools including Winslow Elementary School, Winslow Junior High School, and Winslow High School.
Ownership History
Date
Name
Owned For
Owner Type
Purchase Details
Closed on
Aug 17, 2015
Sold by
Waceken Danny J and Ouellette Michael C
Bought by
Lamanteer Christine A
Current Estimated Value
Home Financials for this Owner
Home Financials are based on the most recent Mortgage that was taken out on this home.
Original Mortgage
$128,250
Outstanding Balance
$101,039
Interest Rate
4.08%
Mortgage Type
New Conventional
Estimated Equity
$192,045
Purchase Details
Closed on
May 18, 2015
Sold by
Duguay Alberta M Est
Bought by
Duguay Bruce W
Create a Home Valuation Report for This Property
The Home Valuation Report is an in-depth analysis detailing your home's value as well as a comparison with similar homes in the area
Home Values in the Area
Average Home Value in this Area
Purchase History
| Date | Buyer | Sale Price | Title Company |
|---|---|---|---|
| Lamanteer Christine A | -- | -- | |
| Duguay Bruce W | -- | -- |
Source: Public Records
Mortgage History
| Date | Status | Borrower | Loan Amount |
|---|---|---|---|
| Open | Lamanteer Christine A | $128,250 |
Source: Public Records
Tax History
| Year | Tax Paid | Tax Assessment Tax Assessment Total Assessment is a certain percentage of the fair market value that is determined by local assessors to be the total taxable value of land and additions on the property. | Land | Improvement |
|---|---|---|---|---|
| 2024 | $3,708 | $247,200 | $46,000 | $201,200 |
| 2023 | $3,708 | $247,200 | $46,000 | $201,200 |
| 2022 | $2,357 | $135,500 | $24,200 | $111,300 |
| 2021 | $2,176 | $132,700 | $24,200 | $108,500 |
| 2020 | $2,027 | $132,700 | $24,200 | $108,500 |
| 2019 | $2,474 | $132,700 | $24,200 | $108,500 |
| 2018 | $2,022 | $132,700 | $24,200 | $108,500 |
| 2017 | $1,866 | $132,700 | $24,200 | $108,500 |
| 2016 | $2,089 | $132,700 | $24,200 | $108,500 |
| 2015 | $1,911 | $123,300 | $24,200 | $99,100 |
| 2014 | $1,911 | $123,300 | $24,200 | $99,100 |
Source: Public Records
Map
Nearby Homes
Your Personal Tour Guide
Ask me questions while you tour the home.