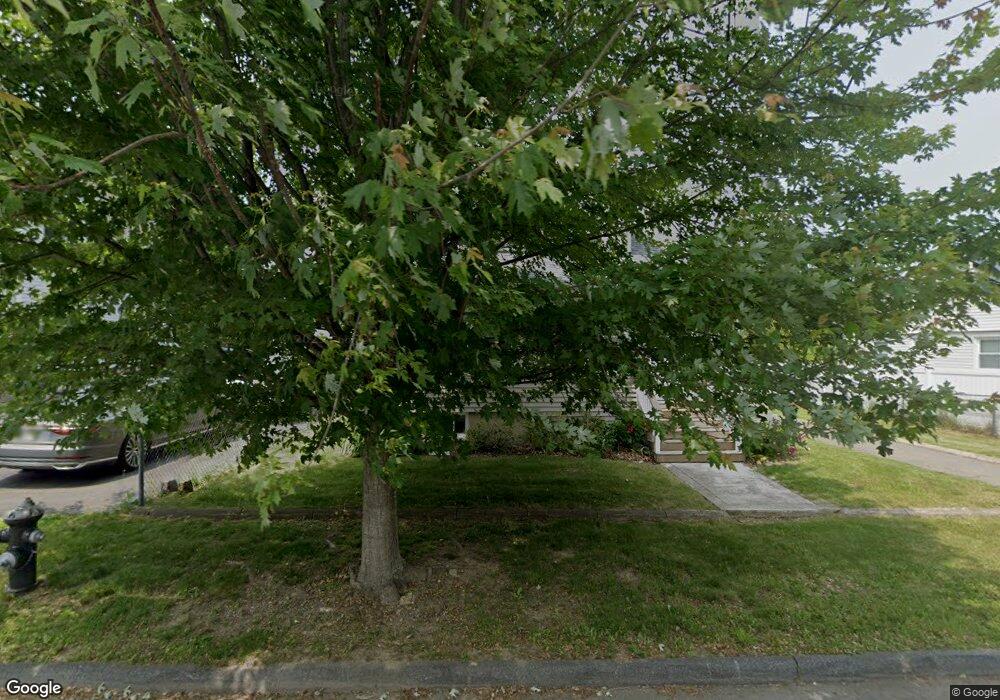
57 Custer St Brockton, MA 02301
Clifton Heights NeighborhoodEstimated Value: $409,000 - $493,000
3
Beds
2
Baths
1,357
Sq Ft
$338/Sq Ft
Est. Value
About This Home
This home is located at 57 Custer St, Brockton, MA 02301 and is currently estimated at $458,498, approximately $337 per square foot. 57 Custer St is a home located in Plymouth County with nearby schools including John F. Kennedy Elementary School, Davis K-8 School, and South Middle School.
Ownership History
Date
Name
Owned For
Owner Type
Purchase Details
Closed on
Nov 6, 2023
Sold by
Suba Damian
Bought by
Suba Damian and Suba Nicholas Latoya
Current Estimated Value
Purchase Details
Closed on
Jul 30, 2009
Sold by
Ferreira John and Ferreira Ana
Bought by
Green Marlon D
Home Financials for this Owner
Home Financials are based on the most recent Mortgage that was taken out on this home.
Original Mortgage
$177,515
Interest Rate
5.43%
Mortgage Type
Purchase Money Mortgage
Purchase Details
Closed on
Jun 17, 2005
Sold by
Dobson Jacqueline
Bought by
Ferreira John and Ferreira Ana
Purchase Details
Closed on
Oct 1, 1996
Sold by
Macdonald Charles E and Macdonald Kathleen Sa
Bought by
Dobson Keith B and Debraux Jacqueline
Purchase Details
Closed on
Feb 24, 1989
Sold by
Moses Marilyn J
Bought by
Macdonald Charles E
Create a Home Valuation Report for This Property
The Home Valuation Report is an in-depth analysis detailing your home's value as well as a comparison with similar homes in the area
Home Values in the Area
Average Home Value in this Area
Purchase History
| Date | Buyer | Sale Price | Title Company |
|---|---|---|---|
| Suba Damian | -- | None Available | |
| Green Marlon D | $180,790 | -- | |
| Ferreira John | $302,500 | -- | |
| Dobson Keith B | $92,900 | -- | |
| Macdonald Charles E | $137,500 | -- |
Source: Public Records
Mortgage History
| Date | Status | Borrower | Loan Amount |
|---|---|---|---|
| Previous Owner | Macdonald Charles E | $177,515 | |
| Previous Owner | Macdonald Charles E | $10,472 |
Source: Public Records
Tax History Compared to Growth
Tax History
| Year | Tax Paid | Tax Assessment Tax Assessment Total Assessment is a certain percentage of the fair market value that is determined by local assessors to be the total taxable value of land and additions on the property. | Land | Improvement |
|---|---|---|---|---|
| 2025 | $4,590 | $379,000 | $139,100 | $239,900 |
| 2024 | $4,539 | $377,600 | $139,100 | $238,500 |
| 2023 | $4,660 | $359,000 | $103,500 | $255,500 |
| 2022 | $4,293 | $307,300 | $94,000 | $213,300 |
| 2021 | $4,167 | $287,400 | $78,000 | $209,400 |
| 2020 | $3,941 | $260,100 | $73,200 | $186,900 |
| 2019 | $3,781 | $243,300 | $71,300 | $172,000 |
| 2018 | $3,686 | $203,100 | $71,300 | $131,800 |
| 2017 | $3,006 | $186,700 | $71,300 | $115,400 |
| 2016 | $3,193 | $183,900 | $69,100 | $114,800 |
| 2015 | $2,735 | $150,700 | $69,100 | $81,600 |
| 2014 | $2,676 | $147,600 | $69,100 | $78,500 |
Source: Public Records
Map
Nearby Homes
- 57 Custer St
- 63 Custer St
- 63 Custer St Unit 2
- 51 Custer St
- 154 Myrtle St
- 154 Myrtle St Unit 1
- 154 Myrtle St Unit 2
- 148 Myrtle St
- 47 Custer St
- 288 Grafton St
- 284 Grafton St
- 158 Myrtle St
- 58 Custer St
- 144 Myrtle St
- 62 Custer St
- 296 Grafton St Unit 1
- 296 Grafton St
- 52 Custer St
- 66 Custer St
- 162 Myrtle St