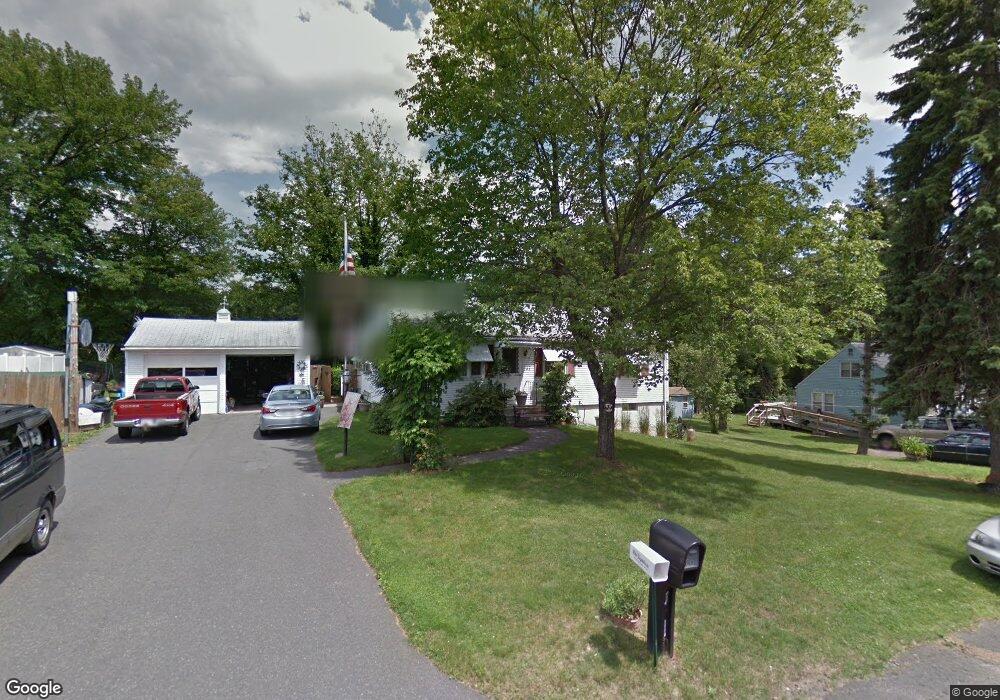
57 Day St Feeding Hills, MA 01030
Estimated Value: $313,000 - $341,000
3
Beds
2
Baths
1,160
Sq Ft
$281/Sq Ft
Est. Value
About This Home
This home is located at 57 Day St, Feeding Hills, MA 01030 and is currently estimated at $325,984, approximately $281 per square foot. 57 Day St is a home located in Hampden County with nearby schools including Agawam Junior High School, Agawam High School, and St Thomas The Apostle School.
Ownership History
Date
Name
Owned For
Owner Type
Purchase Details
Closed on
May 17, 2022
Sold by
Booska-Velozo Nancy L
Bought by
Booska-Velozo Nancy L and Velozo Briana M
Current Estimated Value
Purchase Details
Closed on
Feb 24, 2015
Sold by
Velozo William
Bought by
Booska-Velozo Nancy L
Purchase Details
Closed on
Aug 23, 2001
Sold by
Trask Robert B and Trask Donna L
Bought by
Velozo William and Booska-Velozo Nancy L
Home Financials for this Owner
Home Financials are based on the most recent Mortgage that was taken out on this home.
Original Mortgage
$103,600
Interest Rate
7.21%
Mortgage Type
Purchase Money Mortgage
Create a Home Valuation Report for This Property
The Home Valuation Report is an in-depth analysis detailing your home's value as well as a comparison with similar homes in the area
Home Values in the Area
Average Home Value in this Area
Purchase History
| Date | Buyer | Sale Price | Title Company |
|---|---|---|---|
| Booska-Velozo Nancy L | $1,000 | None Available | |
| Booska-Velozo Nancy L | -- | -- | |
| Velozo William | $129,500 | -- |
Source: Public Records
Mortgage History
| Date | Status | Borrower | Loan Amount |
|---|---|---|---|
| Previous Owner | Velozo William | $112,500 | |
| Previous Owner | Velozo William | $103,600 |
Source: Public Records
Tax History Compared to Growth
Tax History
| Year | Tax Paid | Tax Assessment Tax Assessment Total Assessment is a certain percentage of the fair market value that is determined by local assessors to be the total taxable value of land and additions on the property. | Land | Improvement |
|---|---|---|---|---|
| 2025 | $4,112 | $280,900 | $101,600 | $179,300 |
| 2024 | $4,012 | $275,900 | $101,600 | $174,300 |
| 2023 | $3,702 | $234,600 | $88,000 | $146,600 |
| 2022 | $3,584 | $222,500 | $88,000 | $134,500 |
| 2021 | $3,325 | $197,900 | $77,800 | $120,100 |
| 2020 | $3,253 | $193,300 | $76,700 | $116,600 |
| 2019 | $3,155 | $189,500 | $75,100 | $114,400 |
| 2018 | $3,015 | $181,500 | $75,100 | $106,400 |
| 2017 | $2,869 | $175,900 | $75,100 | $100,800 |
| 2016 | $2,814 | $173,900 | $75,100 | $98,800 |
| 2015 | $2,666 | $169,400 | $75,100 | $94,300 |
Source: Public Records
Map
Nearby Homes
- 64 Blairs Hill Rd
- 468 Springfield St
- 56 Taft St
- 86 Willow Brook Dr
- 712 Cooper St
- 335-337 Springfield St
- 36-38 Rowley St
- 25 Damato Way
- 267 Rowley St
- lot A North St
- 94 Witheridge St
- 67 Colemore St
- 354 Rowley St
- 7 Agnoli Place
- 691 Mill St
- 190 Mill St
- 138 Suffield St
- 64 Woodside Dr
- 50 Howard St
- 73 Silver Lake Dr