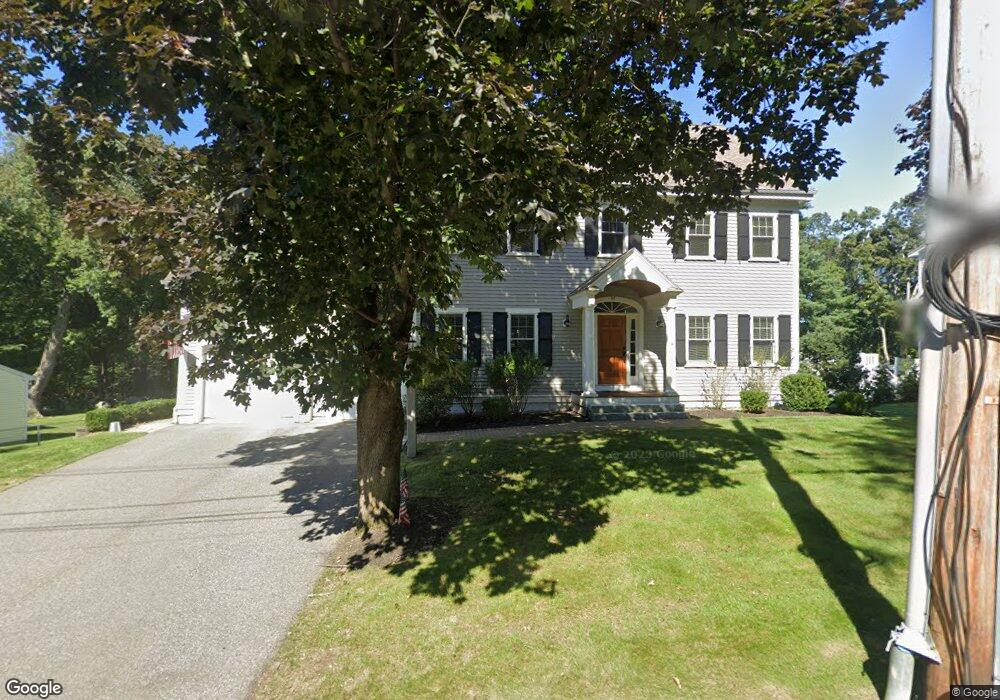
57 Dividence Rd Reading, MA 01867
Estimated Value: $1,558,779 - $1,749,000
4
Beds
3
Baths
3,593
Sq Ft
$467/Sq Ft
Est. Value
About This Home
This home is located at 57 Dividence Rd, Reading, MA 01867 and is currently estimated at $1,676,695, approximately $466 per square foot. 57 Dividence Rd is a home with nearby schools including Wood End Elementary School, Arthur W. Coolidge Middle School, and Reading Memorial High School.
Ownership History
Date
Name
Owned For
Owner Type
Purchase Details
Closed on
Jan 18, 2013
Sold by
57 Dividence Road Llc
Bought by
Cullen Joseph A and Cullen Lee A
Current Estimated Value
Home Financials for this Owner
Home Financials are based on the most recent Mortgage that was taken out on this home.
Original Mortgage
$647,550
Outstanding Balance
$450,664
Interest Rate
3.39%
Mortgage Type
Purchase Money Mortgage
Estimated Equity
$1,226,031
Purchase Details
Closed on
Jul 25, 2012
Sold by
Tormey John F
Bought by
57 Dividende Road Llc
Home Financials for this Owner
Home Financials are based on the most recent Mortgage that was taken out on this home.
Original Mortgage
$600,000
Interest Rate
3.74%
Mortgage Type
Purchase Money Mortgage
Create a Home Valuation Report for This Property
The Home Valuation Report is an in-depth analysis detailing your home's value as well as a comparison with similar homes in the area
Home Values in the Area
Average Home Value in this Area
Purchase History
| Date | Buyer | Sale Price | Title Company |
|---|---|---|---|
| Cullen Joseph A | $809,486 | -- | |
| 57 Dividende Road Llc | $355,000 | -- |
Source: Public Records
Mortgage History
| Date | Status | Borrower | Loan Amount |
|---|---|---|---|
| Open | Cullen Joseph A | $647,550 | |
| Closed | Cullen Joseph A | $80,900 | |
| Previous Owner | 57 Dividende Road Llc | $600,000 |
Source: Public Records
Tax History Compared to Growth
Tax History
| Year | Tax Paid | Tax Assessment Tax Assessment Total Assessment is a certain percentage of the fair market value that is determined by local assessors to be the total taxable value of land and additions on the property. | Land | Improvement |
|---|---|---|---|---|
| 2025 | $15,390 | $1,351,200 | $522,200 | $829,000 |
| 2024 | $15,256 | $1,301,700 | $503,100 | $798,600 |
| 2023 | $15,311 | $1,216,100 | $470,000 | $746,100 |
| 2022 | $15,010 | $1,126,000 | $435,200 | $690,800 |
| 2021 | $7,674 | $1,000,500 | $413,500 | $587,000 |
| 2020 | $5,178 | $985,800 | $407,400 | $578,400 |
| 2019 | $13,897 | $976,600 | $403,600 | $573,000 |
| 2018 | $10,427 | $936,000 | $399,800 | $536,200 |
| 2017 | $12,508 | $891,500 | $380,800 | $510,700 |
| 2016 | $10,991 | $758,000 | $350,000 | $408,000 |
| 2015 | $11,143 | $758,000 | $350,000 | $408,000 |
| 2014 | $11,173 | $758,000 | $350,000 | $408,000 |
Source: Public Records
Map
Nearby Homes