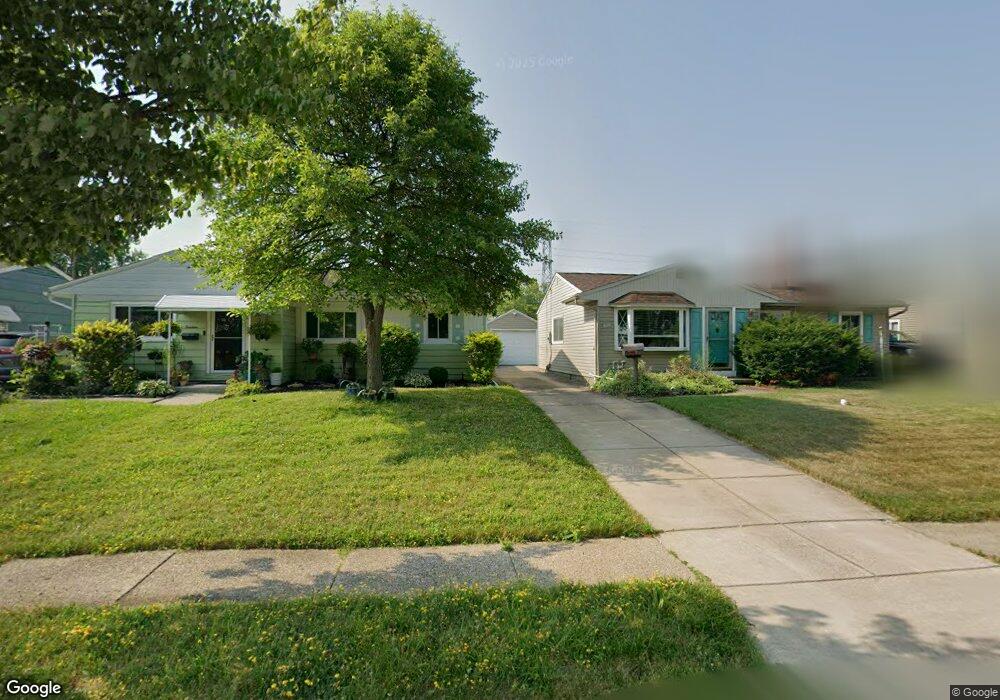
57 Dreyer Ave Tonawanda, NY 14150
Estimated Value: $221,000 - $269,000
3
Beds
1
Bath
1,057
Sq Ft
$234/Sq Ft
Est. Value
About This Home
This home is located at 57 Dreyer Ave, Tonawanda, NY 14150 and is currently estimated at $247,135, approximately $233 per square foot. 57 Dreyer Ave is a home located in Erie County with nearby schools including Thomas A. Edison Elementary School, Ben Franklin Middle School, and Kenmore East Senior High School.
Ownership History
Date
Name
Owned For
Owner Type
Purchase Details
Closed on
Dec 17, 2021
Sold by
Malik Joann and Caruso Joann L
Bought by
Malik Joann and Malik Kevin J
Current Estimated Value
Purchase Details
Closed on
Sep 29, 2009
Sold by
Farolino Joseph
Bought by
Caruso Joann L
Home Financials for this Owner
Home Financials are based on the most recent Mortgage that was taken out on this home.
Original Mortgage
$91,269
Outstanding Balance
$59,719
Interest Rate
5.12%
Mortgage Type
FHA
Estimated Equity
$187,416
Create a Home Valuation Report for This Property
The Home Valuation Report is an in-depth analysis detailing your home's value as well as a comparison with similar homes in the area
Home Values in the Area
Average Home Value in this Area
Purchase History
| Date | Buyer | Sale Price | Title Company |
|---|---|---|---|
| Malik Joann | -- | None Available | |
| Caruso Joann L | $93,000 | None Available |
Source: Public Records
Mortgage History
| Date | Status | Borrower | Loan Amount |
|---|---|---|---|
| Open | Caruso Joann L | $91,269 |
Source: Public Records
Tax History Compared to Growth
Tax History
| Year | Tax Paid | Tax Assessment Tax Assessment Total Assessment is a certain percentage of the fair market value that is determined by local assessors to be the total taxable value of land and additions on the property. | Land | Improvement |
|---|---|---|---|---|
| 2024 | $6,146 | $49,500 | $11,400 | $38,100 |
| 2023 | $5,993 | $49,500 | $11,400 | $38,100 |
| 2022 | $5,651 | $49,500 | $11,400 | $38,100 |
| 2021 | $5,631 | $49,500 | $11,400 | $38,100 |
| 2020 | $4,209 | $49,500 | $11,400 | $38,100 |
| 2019 | $4,076 | $49,500 | $11,400 | $38,100 |
| 2018 | $4,026 | $49,500 | $11,400 | $38,100 |
| 2017 | $1,905 | $49,500 | $11,400 | $38,100 |
| 2016 | $3,815 | $49,500 | $11,400 | $38,100 |
| 2015 | -- | $49,500 | $11,400 | $38,100 |
| 2014 | -- | $49,500 | $11,400 | $38,100 |
Source: Public Records
Map
Nearby Homes