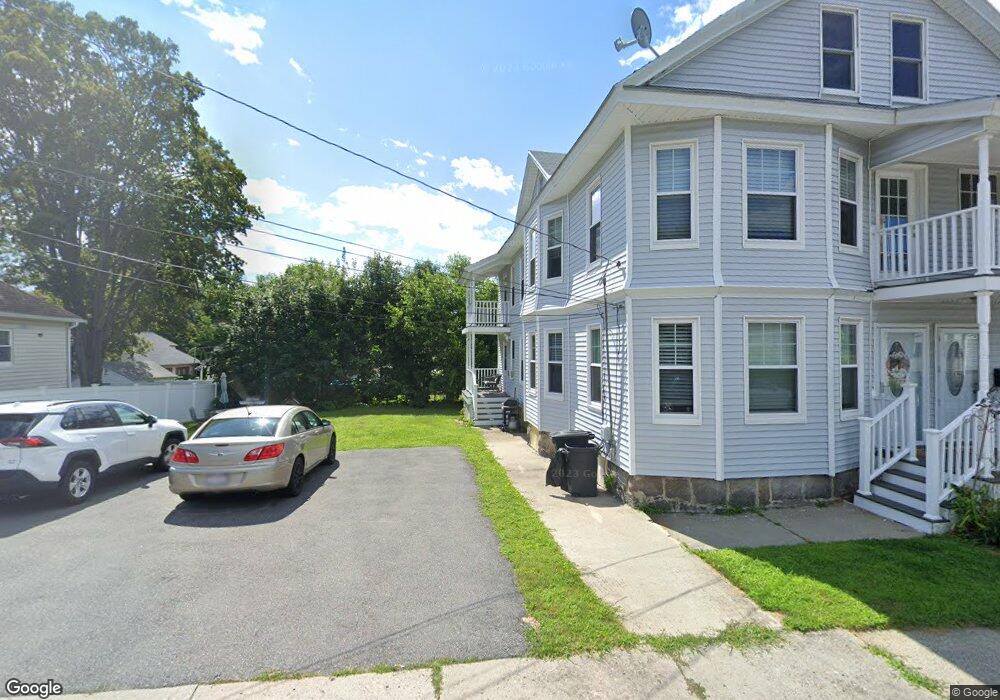
57 Durrell St Methuen, MA 01844
Downtown Methuen NeighborhoodEstimated Value: $625,000 - $806,000
4
Beds
2
Baths
2,592
Sq Ft
$276/Sq Ft
Est. Value
About This Home
This home is located at 57 Durrell St, Methuen, MA 01844 and is currently estimated at $714,136, approximately $275 per square foot. 57 Durrell St is a home located in Essex County with nearby schools including Tenney Grammar School, Methuen High School, and Lawrence Family Development Charter School.
Ownership History
Date
Name
Owned For
Owner Type
Purchase Details
Closed on
Dec 8, 2014
Sold by
Michaud Linda E
Bought by
Hanson Brittany
Current Estimated Value
Home Financials for this Owner
Home Financials are based on the most recent Mortgage that was taken out on this home.
Original Mortgage
$247,000
Outstanding Balance
$189,270
Interest Rate
3.93%
Mortgage Type
New Conventional
Estimated Equity
$524,866
Purchase Details
Closed on
Aug 17, 2012
Sold by
Fleming Eileen G
Bought by
Michaud Linda E
Create a Home Valuation Report for This Property
The Home Valuation Report is an in-depth analysis detailing your home's value as well as a comparison with similar homes in the area
Home Values in the Area
Average Home Value in this Area
Purchase History
| Date | Buyer | Sale Price | Title Company |
|---|---|---|---|
| Hanson Brittany | $275,000 | -- | |
| Hanson Brittany | $275,000 | -- | |
| Michaud Linda E | -- | -- | |
| Michaud Linda E | -- | -- |
Source: Public Records
Mortgage History
| Date | Status | Borrower | Loan Amount |
|---|---|---|---|
| Open | Hanson Brittany | $247,000 | |
| Closed | Michaud Linda E | $247,000 |
Source: Public Records
Tax History
| Year | Tax Paid | Tax Assessment Tax Assessment Total Assessment is a certain percentage of the fair market value that is determined by local assessors to be the total taxable value of land and additions on the property. | Land | Improvement |
|---|---|---|---|---|
| 2025 | $6,938 | $655,800 | $201,300 | $454,500 |
| 2024 | $6,332 | $583,100 | $183,600 | $399,500 |
| 2023 | $6,181 | $528,300 | $163,200 | $365,100 |
| 2022 | $5,527 | $423,500 | $129,200 | $294,300 |
| 2021 | $5,288 | $400,900 | $122,400 | $278,500 |
| 2020 | $5,071 | $377,300 | $122,400 | $254,900 |
| 2019 | $4,661 | $328,500 | $115,600 | $212,900 |
| 2018 | $4,322 | $302,900 | $108,800 | $194,100 |
| 2017 | $4,228 | $288,600 | $108,800 | $179,800 |
| 2016 | $3,771 | $254,600 | $95,200 | $159,400 |
| 2015 | $3,616 | $247,700 | $95,200 | $152,500 |
Source: Public Records
Map
Nearby Homes
- 76 Haverhill St
- 14-16 Cypress Ave
- 945 Riverside Dr Unit 3B
- 42-44 Cypress Ave
- 13 Caswell Ave
- 22 Falcon St
- 65 Clayton Ave
- 37 Maplewood Ave
- 1100 Essex St
- 1082 Essex St
- 1146 Essex St
- 20 Ruskin Ave
- 15 Crescent St Unit D
- 20-22 Ashland Ave
- 11 Crescent St
- 499 Haverhill St
- 1008 Essex St Unit 1010
- 7 Field Ave
- 83 Arnold St
- 70 Butler St
Your Personal Tour Guide
Ask me questions while you tour the home.