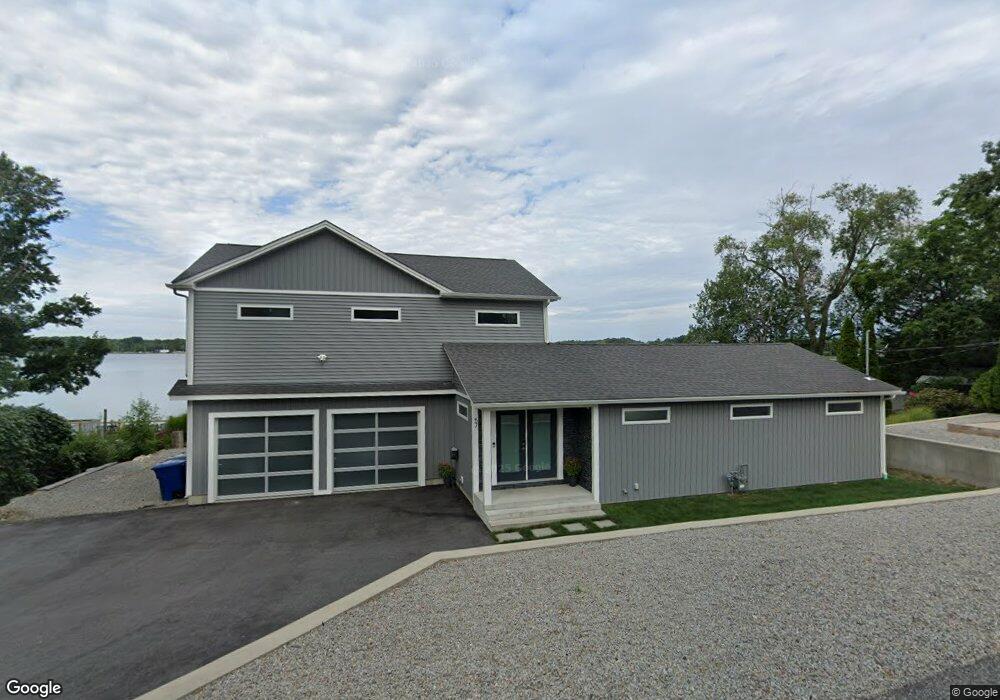
57 E Shore Dr Coventry, RI 02816
Estimated Value: $459,000 - $587,000
3
Beds
2
Baths
2,024
Sq Ft
$255/Sq Ft
Est. Value
About This Home
This home is located at 57 E Shore Dr, Coventry, RI 02816 and is currently estimated at $515,192, approximately $254 per square foot. 57 E Shore Dr is a home located in Kent County with nearby schools including Alan Shawn Feinstein Ms Of Cov, Coventry High School, and Father John V. Doyle School.
Ownership History
Date
Name
Owned For
Owner Type
Purchase Details
Closed on
Oct 21, 2025
Sold by
Matthews Jon H and Dimicco Pamela J
Bought by
Matthews Jon H
Current Estimated Value
Purchase Details
Closed on
Oct 13, 2022
Sold by
Mathews Jon H
Bought by
Mathews Jon H and Dimlcco Pamela J
Purchase Details
Closed on
Dec 16, 2020
Sold by
Lamont Joan C
Bought by
Mathews Jon H
Home Financials for this Owner
Home Financials are based on the most recent Mortgage that was taken out on this home.
Original Mortgage
$184,000
Interest Rate
2.7%
Mortgage Type
New Conventional
Create a Home Valuation Report for This Property
The Home Valuation Report is an in-depth analysis detailing your home's value as well as a comparison with similar homes in the area
Purchase History
| Date | Buyer | Sale Price | Title Company |
|---|---|---|---|
| Matthews Jon H | -- | -- | |
| Mathews Jon H | -- | None Available | |
| Mathews Jon H | $230,000 | None Available |
Source: Public Records
Mortgage History
| Date | Status | Borrower | Loan Amount |
|---|---|---|---|
| Previous Owner | Mathews Jon H | $184,000 |
Source: Public Records
Tax History
| Year | Tax Paid | Tax Assessment Tax Assessment Total Assessment is a certain percentage of the fair market value that is determined by local assessors to be the total taxable value of land and additions on the property. | Land | Improvement |
|---|---|---|---|---|
| 2025 | $7,850 | $487,900 | $203,800 | $284,100 |
| 2024 | $7,728 | $487,900 | $203,800 | $284,100 |
| 2023 | $7,480 | $487,900 | $203,800 | $284,100 |
| 2022 | $6,086 | $311,000 | $156,700 | $154,300 |
| 2021 | $5,044 | $260,000 | $156,700 | $103,300 |
| 2020 | $5,782 | $260,000 | $156,700 | $103,300 |
| 2019 | $5,195 | $233,600 | $144,200 | $89,400 |
| 2018 | $5,048 | $233,600 | $144,200 | $89,400 |
| 2017 | $4,901 | $233,600 | $144,200 | $89,400 |
| 2016 | $4,136 | $193,200 | $112,200 | $81,000 |
| 2015 | $4,024 | $193,200 | $112,200 | $81,000 |
| 2014 | $4,207 | $193,200 | $112,200 | $81,000 |
| 2013 | $4,010 | $214,900 | $121,000 | $93,900 |
Source: Public Records
Map
Nearby Homes
- 21 Darton St
- 22 Rawlinson Dr
- 1 Pettine St
- 22 Colorado St
- 275 E Shore Dr
- 251 E Shore Dr
- 20 Pine Way Blvd
- 19 Pine Way Blvd
- 11 Kennedy Dr
- 45 Pine Ave Unit 36
- 10 Colonial Rd
- 91 Windsor Park Dr
- 27 Matteson St
- 32 Pilgrim Ave
- 311 Arnold Rd
- 4 York Dr
- 86 Wood St
- 9 Holmes Rd
- 505 Washington St
- 513 Washington St
Your Personal Tour Guide
Ask me questions while you tour the home.