
Seller's Agent in 2024
Yelfry Torres
Century 21 AllPoints Realty
(413) 219-3221
6 in this area
76 Total Sales

Estimated Value: $233,000 - $284,000
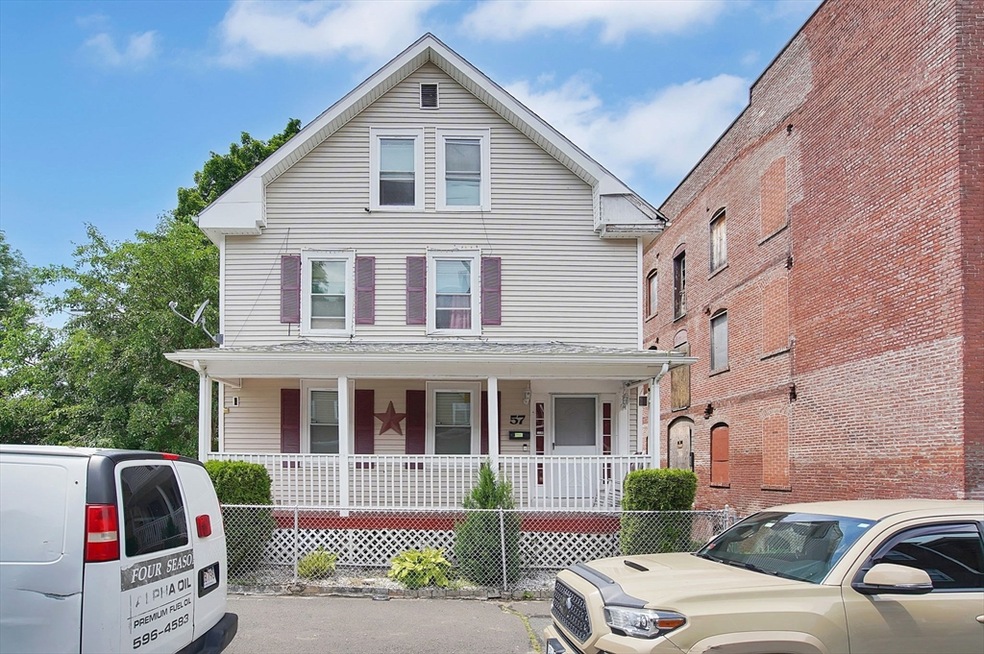
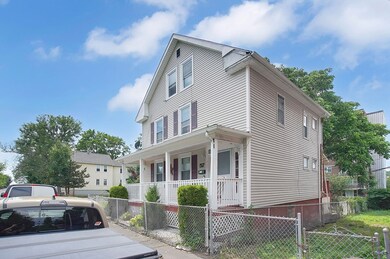
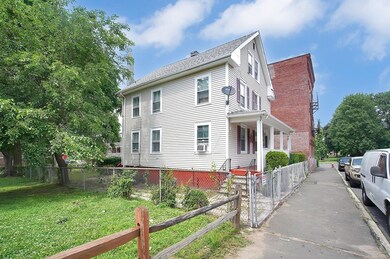
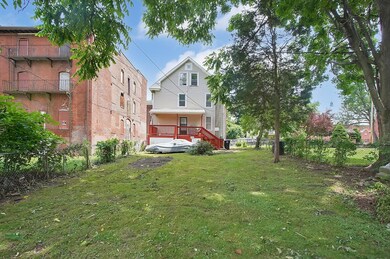
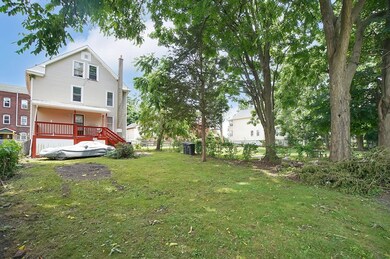
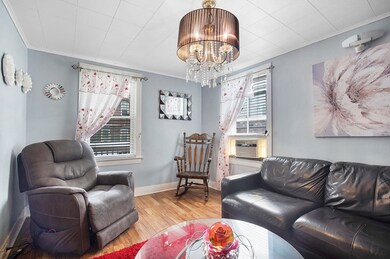
Do not miss your chance to own this beautiful expansive Colonial located close to highways, restaurants, parks, health centers and other amenities. This gorgeous home features a large kitchen with appliances that stay for the buyers enjoinment, 5 good -sized bedrooms and 2 bathrooms. The lower level has extra high ceilings for future additional square footage. Large fenced in back yard. Newer gas furnace and newer roof. Front and back decks are newer.
| Date | Buyer | Sale Price | Title Company |
|---|---|---|---|
| Chiang Mai Llc | -- | None Available | |
| Chiang Mai Llc | -- | None Available | |
| Cpi Housing Fund Llc | $20,000 | -- | |
| Federal National Mortgage Association | $106,021 | -- | |
| Lara Jose L | $125,000 | -- | |
| Lara Alfonso | $55,000 | -- | |
| Jp Morgan Chase Bk | $66,000 | -- | |
| Hartling Richard G | $32,000 | -- | |
| Cpi Housing Fund Llc | $20,000 | -- | |
| Federal National Mortgage Association | $106,021 | -- | |
| Lara Jose L | $125,000 | -- | |
| Lara Alfonso | $55,000 | -- | |
| Jp Morgan Chase Bk | $66,000 | -- | |
| Hartling Richard G | $32,000 | -- |
| Date | Status | Borrower | Loan Amount |
|---|---|---|---|
| Previous Owner | Lara Jose L | $112,500 | |
| Previous Owner | Hartling Richard G | $32,800 |
| Date | Event | Price | List to Sale | Price per Sq Ft | Prior Sale |
|---|---|---|---|---|---|
| 08/30/2024 08/30/24 | Sold | $247,000 | -6.8% | $152 / Sq Ft | |
| 07/15/2024 07/15/24 | Pending | -- | -- | -- | |
| 06/28/2024 06/28/24 | For Sale | $264,900 | +959.6% | $163 / Sq Ft | |
| 04/06/2012 04/06/12 | Sold | $25,000 | +0.4% | $15 / Sq Ft | View Prior Sale |
| 03/12/2012 03/12/12 | Pending | -- | -- | -- | |
| 02/20/2012 02/20/12 | Price Changed | $24,900 | -16.7% | $15 / Sq Ft | |
| 01/07/2012 01/07/12 | Price Changed | $29,900 | -8.0% | $18 / Sq Ft | |
| 12/17/2011 12/17/11 | Price Changed | $32,500 | -6.9% | $20 / Sq Ft | |
| 12/07/2011 12/07/11 | For Sale | $34,900 | 0.0% | $21 / Sq Ft | |
| 12/07/2011 12/07/11 | Pending | -- | -- | -- | |
| 10/18/2011 10/18/11 | Price Changed | $34,900 | -6.9% | $21 / Sq Ft | |
| 09/13/2011 09/13/11 | Price Changed | $37,500 | -24.8% | $23 / Sq Ft | |
| 09/09/2011 09/09/11 | For Sale | $49,900 | -- | $31 / Sq Ft |
| Year | Tax Paid | Tax Assessment Tax Assessment Total Assessment is a certain percentage of the fair market value that is determined by local assessors to be the total taxable value of land and additions on the property. | Land | Improvement |
|---|---|---|---|---|
| 2025 | $3,548 | $203,200 | $36,100 | $167,100 |
| 2024 | $2,727 | $143,900 | $34,300 | $109,600 |
| 2023 | $2,610 | $139,100 | $34,300 | $104,800 |
| 2022 | $2,196 | $114,000 | $34,300 | $79,700 |
| 2021 | $2,072 | $107,500 | $32,100 | $75,400 |
| 2020 | $1,971 | $103,300 | $32,100 | $71,200 |
| 2019 | $1,838 | $95,300 | $28,300 | $67,000 |
| 2018 | $2,236 | $91,800 | $28,300 | $63,500 |
| 2017 | $1,760 | $91,800 | $28,300 | $63,500 |
| 2016 | $1,728 | $90,400 | $26,800 | $63,600 |
| 2015 | $1,721 | $90,400 | $26,800 | $63,600 |
Seller's Agent in 2024
Yelfry Torres
Century 21 AllPoints Realty
(413) 219-3221
6 in this area
76 Total Sales
D
Seller's Agent in 2012
Donna Brown
DB Associates Realty Group
R
Buyer's Agent in 2012
Ramon Suarez
Lion's Head Real Estate Group
Source: MLS Property Information Network (MLS PIN)
MLS Number: 73258722
APN: HOLY-000006-000004-000004
Disclaimer: Certain information contained herein is derived from information provided by parties other than Homes.com. All information provided is deemed reliable, but is not guaranteed to be accurate and should be independently verified.
![]() The property listing data and information, or the Images, set forth herein were provided to MLS Property Information Network, Inc. from third party sources, including sellers, lessors and public records, and were compiled by MLS Property Information Network, Inc. The property listing data and information, and the Images, are for the personal, non-commercial use of consumers having a good faith interest in purchasing or leasing listed properties of the type displayed to them and may not be used for any purpose other than to identify prospective properties which such consumers may have a good faith interest in purchasing or leasing. MLS Property Information Network, Inc. and its subscribers disclaim any and all representations and warranties as to the accuracy of the property listing data and information, or as to the accuracy of any of the Images, set forth herein.
The property listing data and information, or the Images, set forth herein were provided to MLS Property Information Network, Inc. from third party sources, including sellers, lessors and public records, and were compiled by MLS Property Information Network, Inc. The property listing data and information, and the Images, are for the personal, non-commercial use of consumers having a good faith interest in purchasing or leasing listed properties of the type displayed to them and may not be used for any purpose other than to identify prospective properties which such consumers may have a good faith interest in purchasing or leasing. MLS Property Information Network, Inc. and its subscribers disclaim any and all representations and warranties as to the accuracy of the property listing data and information, or as to the accuracy of any of the Images, set forth herein.