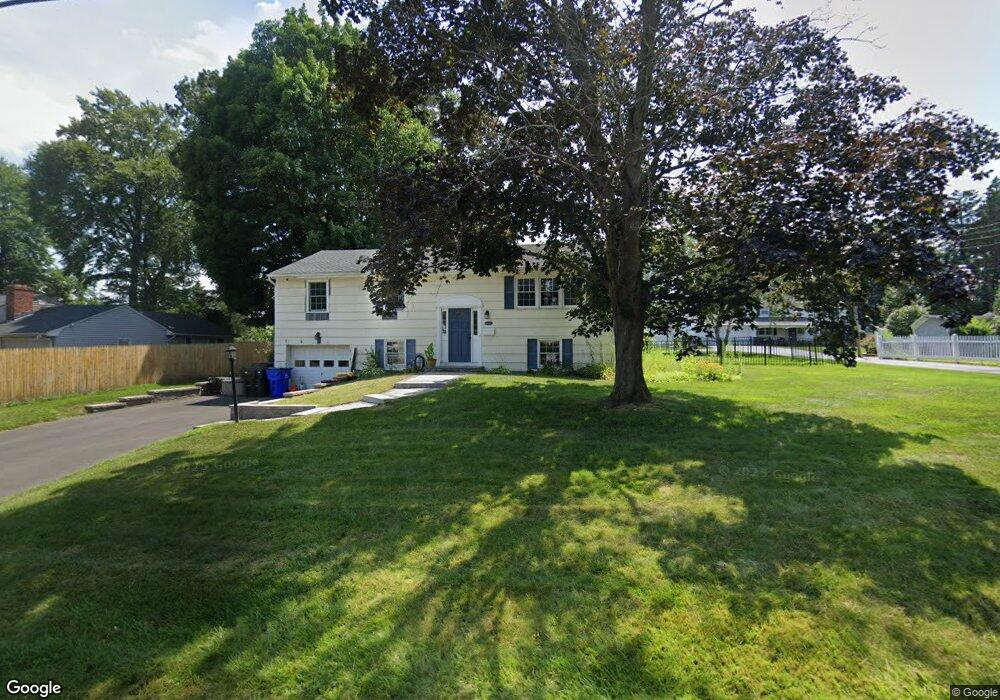
57 Fernwood Dr Windsor Locks, CT 06096
Estimated Value: $346,000 - $400,000
4
Beds
2
Baths
1,488
Sq Ft
$243/Sq Ft
Est. Value
About This Home
This home is located at 57 Fernwood Dr, Windsor Locks, CT 06096 and is currently estimated at $361,780, approximately $243 per square foot. 57 Fernwood Dr is a home located in Hartford County with nearby schools including North Street School, South Elementary School, and Windsor Locks Middle School.
Ownership History
Date
Name
Owned For
Owner Type
Purchase Details
Closed on
Sep 21, 1999
Sold by
Spencer Charles and Spencer Gloria
Bought by
Pfaffenbichler Kenenth and Pfaffenbichler Sharon
Current Estimated Value
Home Financials for this Owner
Home Financials are based on the most recent Mortgage that was taken out on this home.
Original Mortgage
$146,000
Interest Rate
7.83%
Purchase Details
Closed on
Oct 17, 1997
Sold by
Bielicki Joseph and Bielecki Kathleen
Bought by
Muska John and Muska Molly
Create a Home Valuation Report for This Property
The Home Valuation Report is an in-depth analysis detailing your home's value as well as a comparison with similar homes in the area
Home Values in the Area
Average Home Value in this Area
Purchase History
| Date | Buyer | Sale Price | Title Company |
|---|---|---|---|
| Pfaffenbichler Kenenth | $154,000 | -- | |
| Muska John | $89,900 | -- |
Source: Public Records
Mortgage History
| Date | Status | Borrower | Loan Amount |
|---|---|---|---|
| Open | Muska John | $146,400 | |
| Closed | Muska John | $146,000 | |
| Previous Owner | Muska John | $34,000 | |
| Previous Owner | Muska John | $50,000 |
Source: Public Records
Tax History
| Year | Tax Paid | Tax Assessment Tax Assessment Total Assessment is a certain percentage of the fair market value that is determined by local assessors to be the total taxable value of land and additions on the property. | Land | Improvement |
|---|---|---|---|---|
| 2025 | $5,409 | $225,470 | $61,880 | $163,590 |
| 2024 | $3,331 | $118,370 | $48,930 | $69,440 |
| 2023 | $3,117 | $118,370 | $48,930 | $69,440 |
| 2022 | $3,057 | $118,370 | $48,930 | $69,440 |
| 2021 | $3,057 | $118,370 | $48,930 | $69,440 |
| 2020 | $3,057 | $118,370 | $48,930 | $69,440 |
| 2019 | $3,057 | $118,370 | $48,930 | $69,440 |
| 2017 | $3,122 | $117,100 | $47,000 | $70,100 |
| 2016 | $3,122 | $117,100 | $47,000 | $70,100 |
| 2015 | $3,137 | $117,100 | $47,000 | $70,100 |
| 2014 | $3,714 | $141,600 | $53,500 | $88,100 |
Source: Public Records
Map
Nearby Homes
- 22 Pearl St
- 20 Pleasant St Unit 22
- 1453 Suffield St
- 15 Suffield St
- 22 Suffield St
- 42 Chapman Chase Unit 42
- 13 Quail Ct
- 12 Chester Dr
- 202 Reed Ave
- 0 N Water St Unit 24138494
- 0 N Water St Unit 24128295
- 0 N Water St Unit 24128294
- 0 N Water St Unit 24128288
- 0 N Water St
- 59 Elm St
- 64 Main St
- 32 Pleasant Rd
- 660 East St S
- 143 Bridge St
- 4 Woodland Hollow St
Your Personal Tour Guide
Ask me questions while you tour the home.