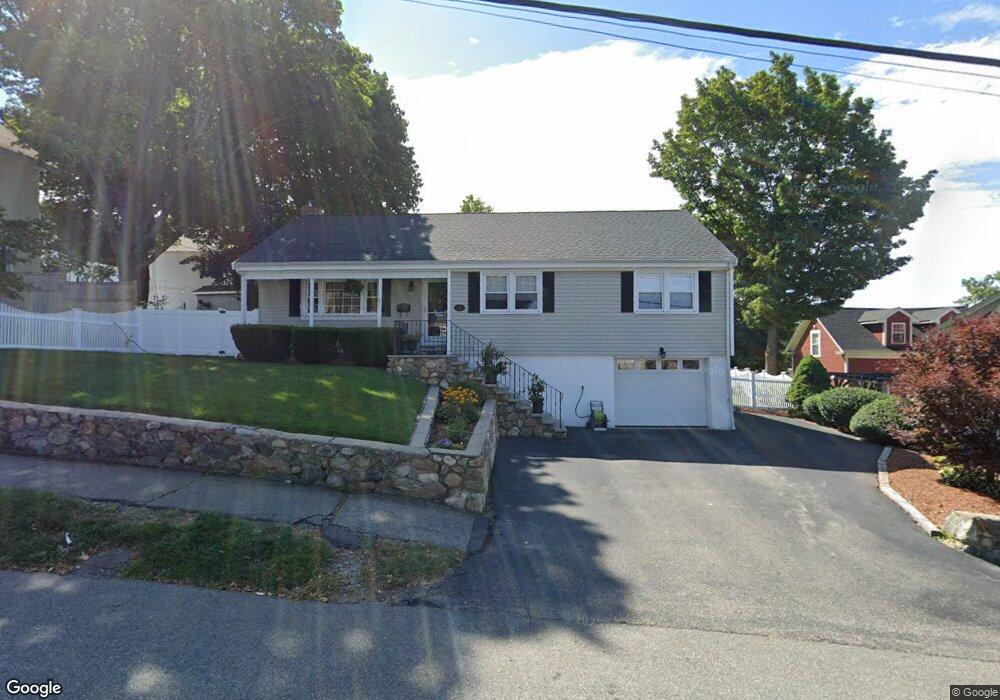
57 Fowle St Woburn, MA 01801
Downtown Woburn NeighborhoodEstimated Value: $650,000 - $770,000
3
Beds
2
Baths
1,260
Sq Ft
$557/Sq Ft
Est. Value
About This Home
This home is located at 57 Fowle St, Woburn, MA 01801 and is currently estimated at $701,864, approximately $557 per square foot. 57 Fowle St is a home located in Middlesex County with nearby schools including Shamrock Elementary School, Daniel L. Joyce Middle School, and Woburn High School.
Ownership History
Date
Name
Owned For
Owner Type
Purchase Details
Closed on
Jun 28, 2024
Sold by
White Ft and White
Bought by
White Forrest Ft and White
Current Estimated Value
Purchase Details
Closed on
Apr 16, 2019
Sold by
White Dennis M and White Margaret
Bought by
White Ft and White
Purchase Details
Closed on
May 18, 2016
Sold by
Krea Michael V and Krea Donna M
Bought by
Krea Ret
Purchase Details
Closed on
Feb 12, 1985
Bought by
White Dennis M
Create a Home Valuation Report for This Property
The Home Valuation Report is an in-depth analysis detailing your home's value as well as a comparison with similar homes in the area
Home Values in the Area
Average Home Value in this Area
Purchase History
| Date | Buyer | Sale Price | Title Company |
|---|---|---|---|
| White Forrest Ft | -- | None Available | |
| White Forrest Ft | -- | None Available | |
| White Ft | -- | -- | |
| White Ft | -- | -- | |
| Krea Ret | -- | -- | |
| White Dennis M | $119,000 | -- | |
| Krea Ret | -- | -- |
Source: Public Records
Mortgage History
| Date | Status | Borrower | Loan Amount |
|---|---|---|---|
| Previous Owner | White Dennis M | $10,000 |
Source: Public Records
Tax History Compared to Growth
Tax History
| Year | Tax Paid | Tax Assessment Tax Assessment Total Assessment is a certain percentage of the fair market value that is determined by local assessors to be the total taxable value of land and additions on the property. | Land | Improvement |
|---|---|---|---|---|
| 2025 | $4,831 | $565,700 | $291,800 | $273,900 |
| 2024 | $4,448 | $551,900 | $278,000 | $273,900 |
| 2023 | $4,503 | $517,600 | $252,700 | $264,900 |
| 2022 | $4,406 | $471,700 | $219,700 | $252,000 |
| 2021 | $4,159 | $445,800 | $209,200 | $236,600 |
| 2020 | $3,929 | $421,600 | $209,200 | $212,400 |
| 2019 | $3,755 | $395,300 | $199,300 | $196,000 |
| 2018 | $3,572 | $361,200 | $182,800 | $178,400 |
| 2017 | $3,452 | $347,300 | $174,100 | $173,200 |
| 2016 | $3,298 | $328,200 | $162,800 | $165,400 |
| 2015 | $3,218 | $316,400 | $152,100 | $164,300 |
| 2014 | $2,932 | $280,800 | $152,100 | $128,700 |
Source: Public Records
Map
Nearby Homes
- 61 Mount Pleasant St
- 69 Eastern Ave
- 39 Garfield Ave
- 62 Jefferson Ave
- 35 Prospect St Unit 215
- 35 Prospect St Unit 204
- 4 Laurel St
- 18 Gardner Ave
- 2 Eastern Ave
- 3 Laurel St
- 7 Prospect St
- 14 Ash St
- 2 George Rd Unit 2
- 1 Boline Place
- 15 Sturgis St
- 14 Cross St
- 9 Wade Ave
- 477 Main St
- 52 Pleasant St
- 27 Arlington Rd Unit 1-6