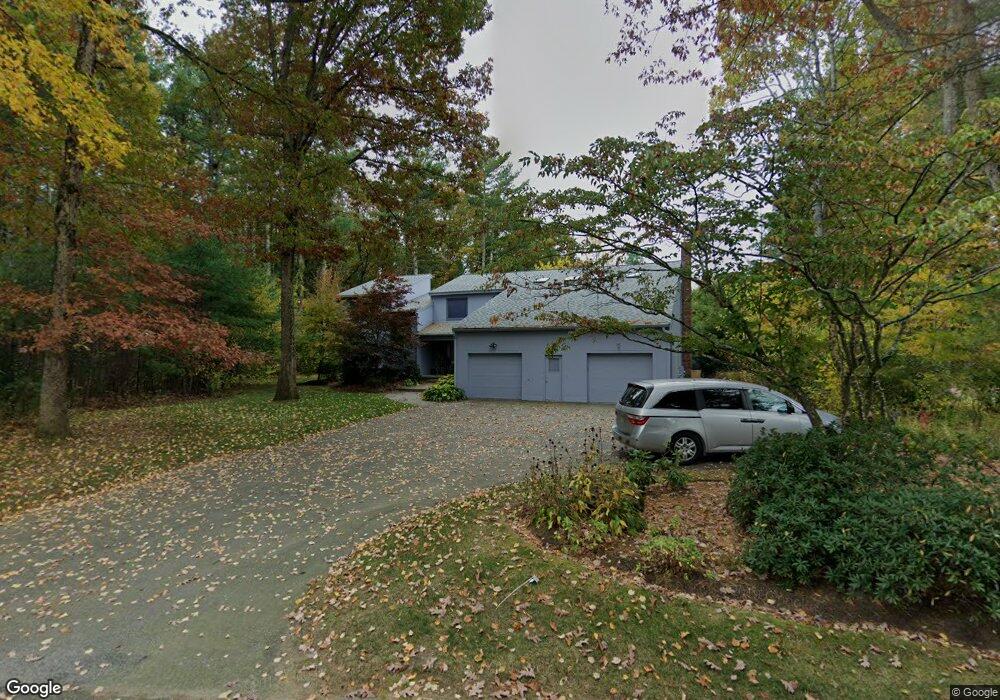
57 Fox Run Rd Sudbury, MA 01776
Estimated Value: $1,657,000 - $1,948,000
4
Beds
5
Baths
4,380
Sq Ft
$412/Sq Ft
Est. Value
About This Home
This home is located at 57 Fox Run Rd, Sudbury, MA 01776 and is currently estimated at $1,806,291, approximately $412 per square foot. 57 Fox Run Rd is a home located in Middlesex County with nearby schools including Peter Noyes Elementary School, Ephraim Curtis Middle School, and Lincoln-Sudbury Regional High School.
Ownership History
Date
Name
Owned For
Owner Type
Purchase Details
Closed on
Feb 17, 2015
Sold by
Fox Run Rt and Eckstein
Bought by
Kaurie Ann Laba T and Kaurie Eckstein
Current Estimated Value
Home Financials for this Owner
Home Financials are based on the most recent Mortgage that was taken out on this home.
Original Mortgage
$417,000
Outstanding Balance
$146,357
Interest Rate
3.9%
Mortgage Type
New Conventional
Estimated Equity
$1,659,934
Purchase Details
Closed on
Mar 3, 2005
Sold by
Laba Laurie Ann and Eckstein Neale I
Bought by
Fox Run Rt and Laba
Purchase Details
Closed on
Dec 2, 1997
Sold by
Millbrook Rlty Co T and Longcope
Bought by
Remili Rt and Eckstein
Purchase Details
Closed on
Jun 2, 1988
Sold by
Legasey Robt
Bought by
Eckstein Neale I
Create a Home Valuation Report for This Property
The Home Valuation Report is an in-depth analysis detailing your home's value as well as a comparison with similar homes in the area
Home Values in the Area
Average Home Value in this Area
Purchase History
| Date | Buyer | Sale Price | Title Company |
|---|---|---|---|
| Kaurie Ann Laba T | -- | -- | |
| Kaurie Ann Laba T | -- | -- | |
| Fox Run Rt | -- | -- | |
| Fox Run Rt | -- | -- | |
| Remili Rt | $235,000 | -- | |
| Eckstein Neale I | $622,500 | -- |
Source: Public Records
Mortgage History
| Date | Status | Borrower | Loan Amount |
|---|---|---|---|
| Open | Kaurie Ann Laba T | $417,000 | |
| Closed | Kaurie Ann Laba T | $417,000 | |
| Previous Owner | Eckstein Neale I | $232,000 | |
| Previous Owner | Eckstein Neale I | $150,000 |
Source: Public Records
Tax History Compared to Growth
Tax History
| Year | Tax Paid | Tax Assessment Tax Assessment Total Assessment is a certain percentage of the fair market value that is determined by local assessors to be the total taxable value of land and additions on the property. | Land | Improvement |
|---|---|---|---|---|
| 2025 | $25,374 | $1,733,200 | $546,600 | $1,186,600 |
| 2024 | $24,425 | $1,671,800 | $530,600 | $1,141,200 |
| 2023 | $22,240 | $1,410,300 | $473,800 | $936,500 |
| 2022 | $20,990 | $1,162,900 | $434,600 | $728,300 |
| 2021 | $20,237 | $1,074,700 | $434,600 | $640,100 |
| 2020 | $19,828 | $1,074,700 | $434,600 | $640,100 |
| 2019 | $19,248 | $1,074,700 | $434,600 | $640,100 |
| 2018 | $18,703 | $1,043,100 | $462,200 | $580,900 |
| 2017 | $17,518 | $987,500 | $457,800 | $529,700 |
| 2016 | $16,962 | $952,900 | $440,200 | $512,700 |
| 2015 | $16,600 | $943,200 | $436,200 | $507,000 |
| 2014 | $16,591 | $920,200 | $424,600 | $495,600 |
Source: Public Records
Map
Nearby Homes
- 7 Saddle Ridge Rd
- 14 Tanbark Rd
- 30 Rolling Ln
- 21 Summer St
- 143 Peakham Rd
- 12 Hickory Rd
- 25 Bridle Path
- 54 Stone Rd
- 89 Bridle Path
- 0 Robbins Rd
- 0 Boston Post Rd
- 270 Old Lancaster Rd
- 7 Adams Rd
- 24 Woodland Rd
- 36 Old Forge Ln
- 47 Fairbank Rd
- 24 Goodnow Rd
- 123 Dutton Rd
- 4 Elderberry Cir
- 1011 Boston Post Rd
- 66 Fox Run Rd
- 71 Fox Run Rd
- 74 Fox Run Rd
- 41 Fox Run Rd
- 8 Saddle Ridge Rd
- 271 Peakham Rd
- 11 Saddle Ridge Rd
- 77 Fox Run Rd
- 84 Fox Run Rd
- 33 Fox Run Rd
- 265 Peakham Rd
- 36 Fox Run Rd
- 16 Saddle Ridge Rd
- 259 Peakham Rd
- 21 Saddle Ridge Rd
- 277 Peakham Rd
- 92 Fox Run Rd
- 83 Fox Run Rd
- 26 Axdell Rd
- 255 Peakham Rd