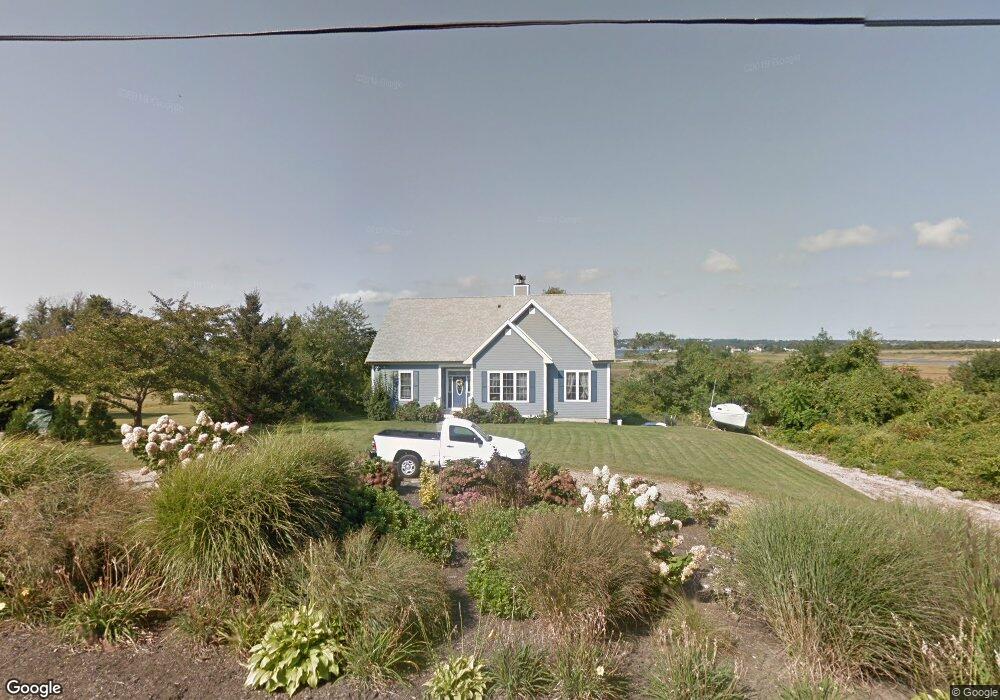
57 Francis Ln Little Compton, RI 02837
Estimated Value: $1,163,634 - $1,935,000
3
Beds
4
Baths
3,140
Sq Ft
$492/Sq Ft
Est. Value
About This Home
This home is located at 57 Francis Ln, Little Compton, RI 02837 and is currently estimated at $1,544,909, approximately $492 per square foot. 57 Francis Ln is a home located in Newport County with nearby schools including Wilbur & McMahon School.
Ownership History
Date
Name
Owned For
Owner Type
Purchase Details
Closed on
Dec 29, 2022
Sold by
Sherman Charles F
Bought by
C Fielding Irt and Sherman
Current Estimated Value
Purchase Details
Closed on
May 16, 2011
Sold by
Sherman Charles F
Bought by
Sherman Charles F and Sherman Susan M
Purchase Details
Closed on
Jan 4, 2006
Sold by
Kaszyk Shirley C
Bought by
Sherman Charles F
Home Financials for this Owner
Home Financials are based on the most recent Mortgage that was taken out on this home.
Original Mortgage
$279,200
Interest Rate
6.28%
Mortgage Type
Purchase Money Mortgage
Create a Home Valuation Report for This Property
The Home Valuation Report is an in-depth analysis detailing your home's value as well as a comparison with similar homes in the area
Home Values in the Area
Average Home Value in this Area
Purchase History
| Date | Buyer | Sale Price | Title Company |
|---|---|---|---|
| C Fielding Irt | -- | None Available | |
| C Fielding Irt | -- | None Available | |
| Sherman Charles F | -- | -- | |
| Sherman Charles F | $349,000 | -- | |
| Sherman Charles F | -- | -- | |
| Sherman Charles F | $349,000 | -- |
Source: Public Records
Mortgage History
| Date | Status | Borrower | Loan Amount |
|---|---|---|---|
| Previous Owner | Sherman Charles F | $279,200 |
Source: Public Records
Tax History
| Year | Tax Paid | Tax Assessment Tax Assessment Total Assessment is a certain percentage of the fair market value that is determined by local assessors to be the total taxable value of land and additions on the property. | Land | Improvement |
|---|---|---|---|---|
| 2025 | $4,756 | $992,800 | $449,900 | $542,900 |
| 2024 | $4,283 | $843,100 | $358,700 | $484,400 |
| 2023 | $4,182 | $843,100 | $358,700 | $484,400 |
| 2022 | $4,131 | $843,100 | $358,700 | $484,400 |
| 2021 | $4,121 | $682,300 | $311,900 | $370,400 |
| 2020 | $4,087 | $682,300 | $311,900 | $370,400 |
| 2019 | $4,046 | $682,300 | $311,900 | $370,400 |
| 2018 | $4,130 | $693,000 | $326,100 | $366,900 |
| 2016 | $3,929 | $693,000 | $326,100 | $366,900 |
| 2015 | $3,939 | $685,100 | $322,200 | $362,900 |
| 2014 | $3,864 | $685,100 | $322,200 | $362,900 |
Source: Public Records
Map
Nearby Homes
Your Personal Tour Guide
Ask me questions while you tour the home.