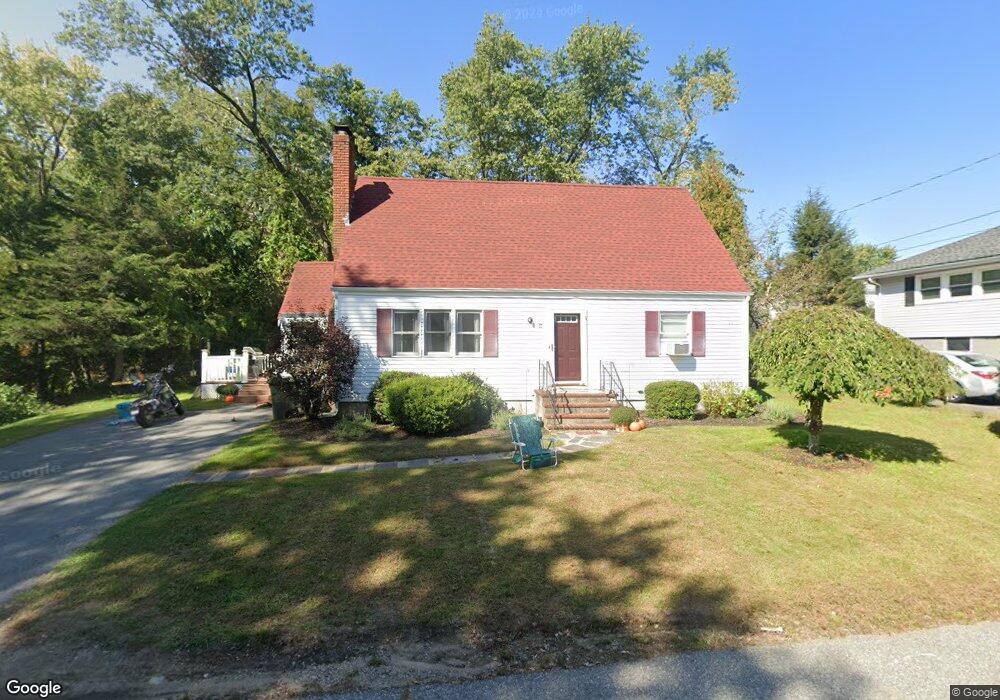
57 Glenwood St North Andover, MA 01845
Estimated Value: $646,896 - $675,000
4
Beds
2
Baths
1,512
Sq Ft
$435/Sq Ft
Est. Value
About This Home
This home is located at 57 Glenwood St, North Andover, MA 01845 and is currently estimated at $658,224, approximately $435 per square foot. 57 Glenwood St is a home located in Essex County with nearby schools including Atkinson Elementary School, North Andover Middle School, and North Andover High School.
Ownership History
Date
Name
Owned For
Owner Type
Purchase Details
Closed on
Jan 23, 2020
Sold by
Goldberg Eitan Y and Goldberg Michelle D
Bought by
Scibelli Frederick and Scibelli Jaime
Current Estimated Value
Home Financials for this Owner
Home Financials are based on the most recent Mortgage that was taken out on this home.
Original Mortgage
$379,050
Outstanding Balance
$335,742
Interest Rate
3.73%
Mortgage Type
New Conventional
Estimated Equity
$322,482
Purchase Details
Closed on
Mar 13, 2015
Sold by
Shadman Ali and Ghamari Azar
Bought by
Goldberg Eitan Y and Goldberg Michelle D
Home Financials for this Owner
Home Financials are based on the most recent Mortgage that was taken out on this home.
Original Mortgage
$278,910
Interest Rate
3.67%
Mortgage Type
New Conventional
Purchase Details
Closed on
Mar 25, 2008
Sold by
Elbeery Ramon J and Elbeery Doris E
Bought by
Shadman Ali and Ghamari Azar
Create a Home Valuation Report for This Property
The Home Valuation Report is an in-depth analysis detailing your home's value as well as a comparison with similar homes in the area
Home Values in the Area
Average Home Value in this Area
Purchase History
| Date | Buyer | Sale Price | Title Company |
|---|---|---|---|
| Scibelli Frederick | $399,000 | None Available | |
| Goldberg Eitan Y | $309,900 | -- | |
| Shadman Ali | $269,000 | -- |
Source: Public Records
Mortgage History
| Date | Status | Borrower | Loan Amount |
|---|---|---|---|
| Open | Scibelli Frederick | $379,050 | |
| Previous Owner | Goldberg Eitan Y | $278,910 |
Source: Public Records
Tax History Compared to Growth
Tax History
| Year | Tax Paid | Tax Assessment Tax Assessment Total Assessment is a certain percentage of the fair market value that is determined by local assessors to be the total taxable value of land and additions on the property. | Land | Improvement |
|---|---|---|---|---|
| 2025 | $5,725 | $508,400 | $293,600 | $214,800 |
| 2024 | $5,522 | $497,900 | $276,400 | $221,500 |
| 2023 | $5,420 | $442,800 | $253,900 | $188,900 |
| 2022 | $5,347 | $395,200 | $228,000 | $167,200 |
| 2021 | $5,307 | $374,500 | $207,300 | $167,200 |
| 2020 | $5,052 | $367,700 | $207,300 | $160,400 |
| 2019 | $4,931 | $367,700 | $207,300 | $160,400 |
| 2018 | $5,343 | $367,700 | $207,300 | $160,400 |
| 2017 | $4,537 | $317,700 | $165,400 | $152,300 |
| 2016 | $4,479 | $313,900 | $162,300 | $151,600 |
| 2015 | $4,262 | $296,200 | $156,700 | $139,500 |
Source: Public Records
Map
Nearby Homes
- 11 Fernwood St
- 177-179 Massachusetts Ave
- 183 Massachusetts Ave
- 350 Greene St Unit 105
- 8 Little Rd
- 114 Beverly St
- 127 Marblehead St Unit A
- 416 Waverley Rd
- 11 Putnam Rd
- 111 Cambridge St Unit D
- 53-55 Phillips St
- 11 Patton St
- 24 Marblehead St
- 59 Maple Ave Unit 59
- 33 Pilgrim St
- 64 Salem St
- 68 Belmont St Unit 68
- 356-360 S Union St
- 176-178 Bailey St
- 82 Salem St
- 57 Glenwood St
- 55 Glenwood St
- 58 Fernwood St
- 45 Glenwood St
- 58 Glenwood St
- 56 Glenwood St
- 52 Fernwood St
- 50 Fernwood St
- 50 Fernwood St Unit A
- 50 Fernwood St Unit 50
- 50B Fernwood St
- 50A Fernwood St Unit A
- 50B Fernwood St Unit B
- 43 Glenwood St
- 45 Harwood St
- 94 Mablin Ave
- 116 Mablin Ave
- 55 Harwood St
- 96 Mablin Ave
- 49 Fernwood St