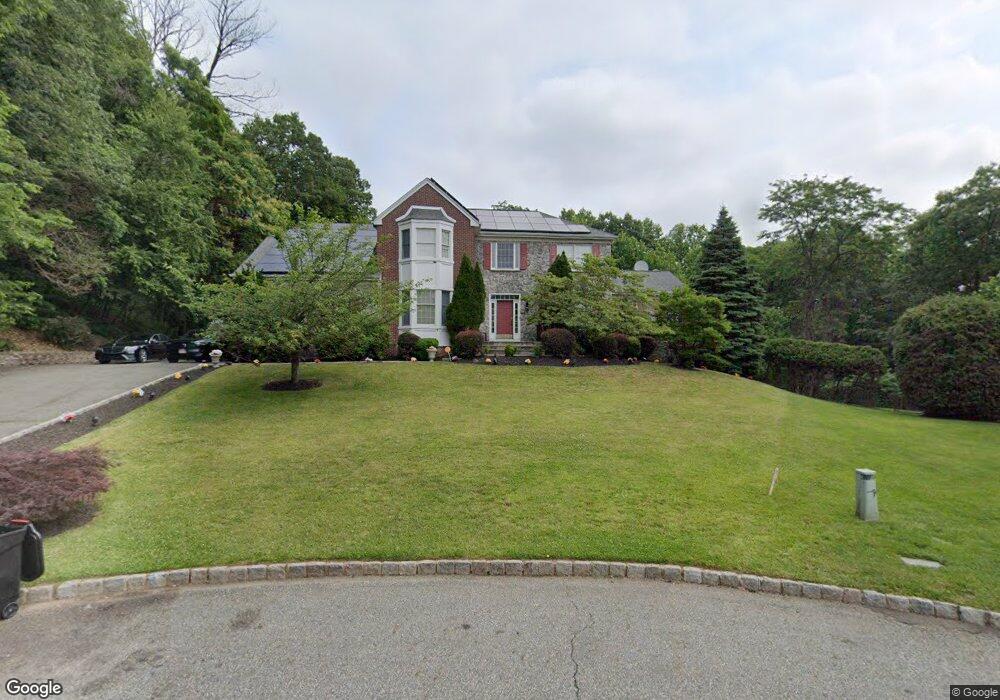
57 Highwood Rd West Orange, NJ 07052
Estimated Value: $1,077,232 - $1,596,000
--
Bed
--
Bath
3,728
Sq Ft
$333/Sq Ft
Est. Value
About This Home
This home is located at 57 Highwood Rd, West Orange, NJ 07052 and is currently estimated at $1,239,808, approximately $332 per square foot. 57 Highwood Rd is a home located in Essex County with nearby schools including West Orange High School and Golda Och Academy Lower School.
Ownership History
Date
Name
Owned For
Owner Type
Purchase Details
Closed on
Oct 28, 2019
Sold by
Rothman Realty I Llc
Bought by
Sangosse Louis and Sangosse Marie
Current Estimated Value
Purchase Details
Closed on
Mar 31, 1999
Sold by
America Dream Home Inc
Bought by
Sangosse Louis and Sangosse Marie
Home Financials for this Owner
Home Financials are based on the most recent Mortgage that was taken out on this home.
Original Mortgage
$408,000
Interest Rate
6.83%
Create a Home Valuation Report for This Property
The Home Valuation Report is an in-depth analysis detailing your home's value as well as a comparison with similar homes in the area
Home Values in the Area
Average Home Value in this Area
Purchase History
| Date | Buyer | Sale Price | Title Company |
|---|---|---|---|
| Sangosse Louis | -- | None Available | |
| Sangosse Louis | $415,000 | -- |
Source: Public Records
Mortgage History
| Date | Status | Borrower | Loan Amount |
|---|---|---|---|
| Previous Owner | Sangosse Louis | $408,000 |
Source: Public Records
Tax History Compared to Growth
Tax History
| Year | Tax Paid | Tax Assessment Tax Assessment Total Assessment is a certain percentage of the fair market value that is determined by local assessors to be the total taxable value of land and additions on the property. | Land | Improvement |
|---|---|---|---|---|
| 2025 | $37,635 | $1,117,500 | $434,800 | $682,700 |
| 2024 | $37,635 | $650,000 | $188,800 | $461,200 |
| 2022 | $36,317 | $818,500 | $188,800 | $629,700 |
| 2021 | $35,637 | $818,500 | $188,800 | $629,700 |
| 2020 | $35,065 | $818,500 | $188,800 | $629,700 |
| 2019 | $34,058 | $818,500 | $188,800 | $629,700 |
| 2018 | $33,051 | $818,500 | $188,800 | $629,700 |
| 2017 | $32,625 | $818,500 | $188,800 | $629,700 |
| 2016 | $31,840 | $818,500 | $188,800 | $629,700 |
| 2015 | $31,242 | $818,500 | $188,800 | $629,700 |
| 2014 | $30,628 | $818,500 | $188,800 | $629,700 |
Source: Public Records
Map
Nearby Homes