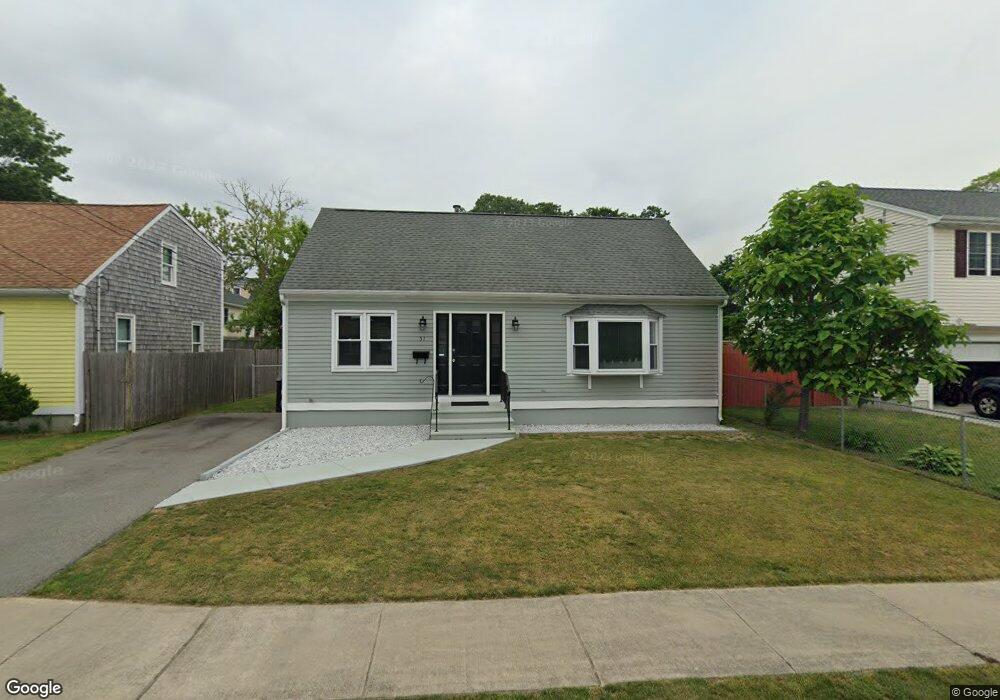
57 Hunter St New Bedford, MA 02740
Downtown New Bedford NeighborhoodEstimated Value: $429,503 - $462,000
3
Beds
2
Baths
1,426
Sq Ft
$311/Sq Ft
Est. Value
About This Home
This home is located at 57 Hunter St, New Bedford, MA 02740 and is currently estimated at $443,626, approximately $311 per square foot. 57 Hunter St is a home located in Bristol County with nearby schools including iQ Academy Minnesota, Thomas R. Rodman Elementary School, and Keith Middle School.
Ownership History
Date
Name
Owned For
Owner Type
Purchase Details
Closed on
Nov 6, 1998
Sold by
Correia Eduardo A and Correia Maria C
Bought by
Silva Arthur R
Current Estimated Value
Home Financials for this Owner
Home Financials are based on the most recent Mortgage that was taken out on this home.
Original Mortgage
$102,600
Outstanding Balance
$22,494
Interest Rate
6.64%
Mortgage Type
Purchase Money Mortgage
Estimated Equity
$421,132
Purchase Details
Closed on
Mar 24, 1989
Sold by
Delgado Devlp Corp
Bought by
Correia Eduardo A
Home Financials for this Owner
Home Financials are based on the most recent Mortgage that was taken out on this home.
Original Mortgage
$80,000
Interest Rate
10.49%
Mortgage Type
Purchase Money Mortgage
Create a Home Valuation Report for This Property
The Home Valuation Report is an in-depth analysis detailing your home's value as well as a comparison with similar homes in the area
Home Values in the Area
Average Home Value in this Area
Purchase History
| Date | Buyer | Sale Price | Title Company |
|---|---|---|---|
| Silva Arthur R | $108,000 | -- | |
| Silva Arthur R | $108,000 | -- | |
| Correia Eduardo A | $110,000 | -- |
Source: Public Records
Mortgage History
| Date | Status | Borrower | Loan Amount |
|---|---|---|---|
| Open | Correia Eduardo A | $102,600 | |
| Closed | Correia Eduardo A | $102,600 | |
| Previous Owner | Correia Eduardo A | $80,000 |
Source: Public Records
Tax History Compared to Growth
Tax History
| Year | Tax Paid | Tax Assessment Tax Assessment Total Assessment is a certain percentage of the fair market value that is determined by local assessors to be the total taxable value of land and additions on the property. | Land | Improvement |
|---|---|---|---|---|
| 2025 | $4,162 | $368,000 | $98,700 | $269,300 |
| 2024 | $4,064 | $338,700 | $91,700 | $247,000 |
| 2023 | $4,498 | $314,800 | $77,600 | $237,200 |
| 2022 | $3,735 | $250,100 | $70,500 | $179,600 |
| 2021 | $3,735 | $239,600 | $67,000 | $172,600 |
| 2020 | $3,865 | $239,200 | $67,000 | $172,200 |
| 2019 | $3,758 | $228,200 | $67,000 | $161,200 |
| 2018 | $3,516 | $211,400 | $67,000 | $144,400 |
| 2017 | $3,276 | $196,300 | $65,200 | $131,100 |
| 2016 | $3,136 | $190,200 | $63,500 | $126,700 |
| 2015 | $2,902 | $184,500 | $63,500 | $121,000 |
| 2014 | $2,726 | $179,800 | $61,700 | $118,100 |
Source: Public Records
Map
Nearby Homes
- 469 Hillman St
- ) Hapwell & Summit St
- 124 Francis St
- 35 Jenny Lind St
- 417 Maxfield St
- 26 Keene St
- 245 Brownell St
- 179 Tremont St
- 605 Union St
- 69 Newton St
- 82 Pierce St
- 122 Armour St
- 212 North St
- 135 Sycamore St
- 119 Tremont St
- 20 Shawmut Ave
- 354-358 Arnold St
- 57 Shawmut Ave
- 41 Tilton St
- 114 Chancery St